Join Our Telegram channel to stay up to date on breaking news coverage
EOS Price Analysis – June 1
EOS seems solid; as the bulls dominate all the time, as the coin prepare to try new heights for this year, with a target of $8 or more. While buyers are now targeting the next price level, it is possible that the market needs to retest the previous support level before triggering.
EOS/USD Market
Key Levels:
Resistance levels: $8.5, $9.5, $11
Support levels: $7.0, $6.0, $5.0
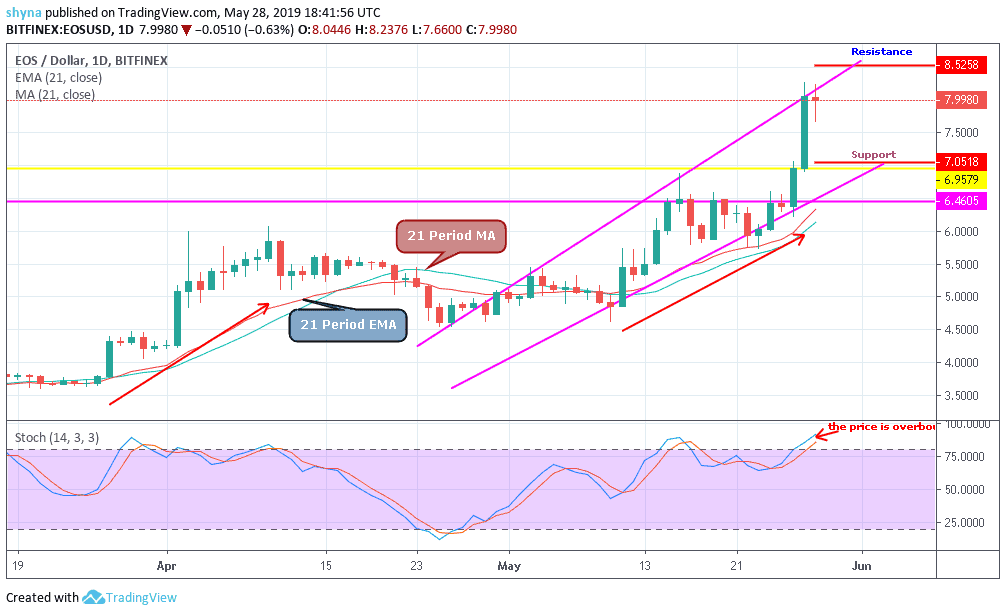
In recent weeks, the EOSUSD market has remained in a growing range in a bullish scenario, with the exception of one week in particular when it fell to support level $5.9. The cryptocurrency erupted on May 24, 2019, and since then price has reached its maximum resistance level of $8.2 for the first time this year; is it tie to buy Bitcoin with PayPal.
As shown in the chart, EOSUSD is currently operating above the 21 MA periods and the 21 EMA periods that move towards the resistance level at $8.5. Given the bullish trend, the trend could revert and reach support levels of $6.0 and $5.0 respectively, since the price has already risen to more than level 70 in Stochastic (14), which is an overbought territory. But if the bullish momentum continues, the price could still rise to the resistance of $9.5 and $11.
EOS/BTC Market
Against BTC, support in this range is built around 0.00083BTC. The resistance is set at 0.00098BTC because the market price has successfully passed the MA period 21. Technically, from February until today, it seems that the graph has managed to divide and correct the approval of the floor found around 0.0007BTC.
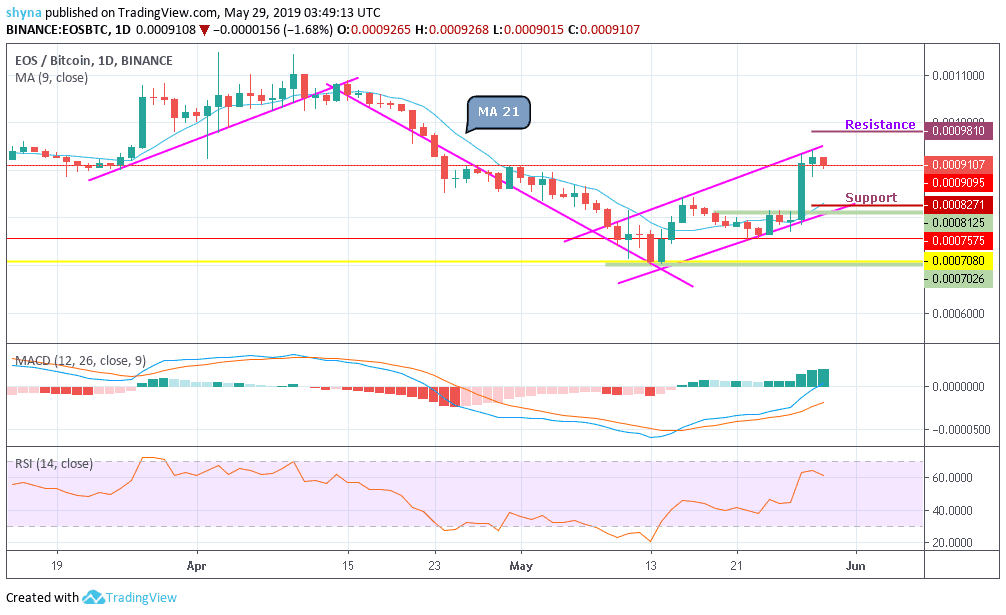
Meanwhile, the period of relative strength index 14 is at 62 levels, with the signal line trying to increase, indicating an upward movement as the price moves into the overbought territory. The MACD indicator in the chart is bullish and is currently generating a strong buy signal that points to the green bar of the indicator.
Please note: Insidebitcoins.com is not a financial advisor. Do your own research before investing your funds in any financial asset or presented product or event. We are not responsible for your investing results.
Join Our Telegram channel to stay up to date on breaking news coverage