
Join Our Telegram channel to stay up to date on breaking news coverage
The dYdX price prediction shows that DYDX is trading near the resistance level of $2.50 around the 9-day and 21-day moving averages.
dYdX Prediction Statistics Data:
- dYdX price now – $2.38
- dYdX market cap – $367.3 million
- dYdX circulating supply – 156.2 million
- dYdX total supply – 1 billion
- dYdX Coinmarketcap ranking – #99
DYDX/USD Market
Key Levels:
Resistance levels: $4.00, $4.20, $4.40
Support levels: $1.00, $0.80, $0.60
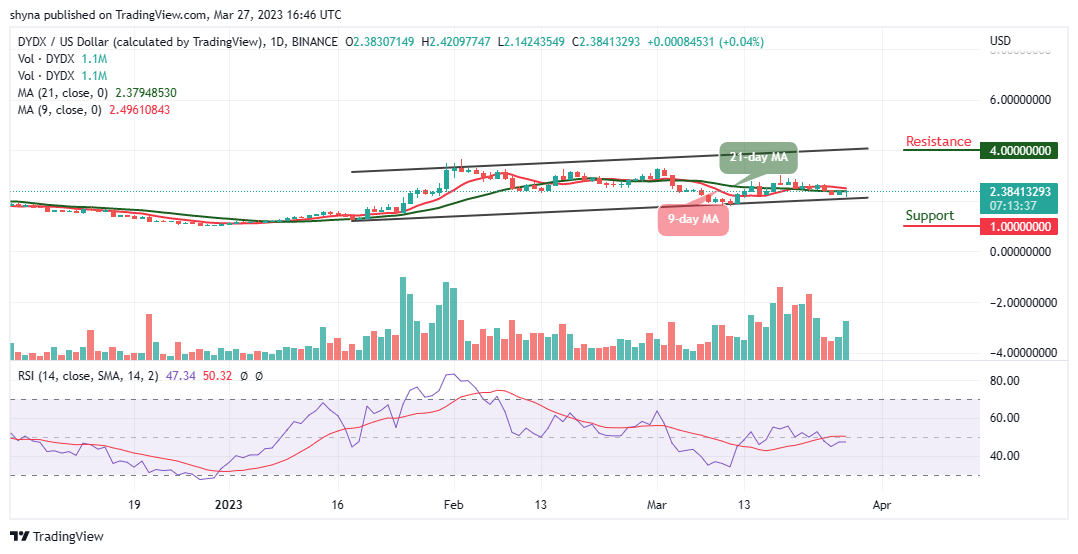
At the time of writing, DYDX/USD is trading at $2.38 within the channel, indicating an indecisive movement in the market. For the time being, the market price is moving towards the resistance level of $2.50 while the trading volume confirms the sideways movement.
dYdX Price Prediction: DYDX Price May Face the North
At the time of writing, the dYdX price is still ranging as the bulls prepare to push the coin to the upside. However, if the buyers regroup and push the dYdX price above the 9-day and 21-day moving average, the market price might revisit the resistance level of $2.42.
Therefore, any bullish movement above this level could lead the market to the crucial resistance levels at $4.00, $4.20, and $4.40 respectively. On the contrary, if the coin crosses below the lower boundary of the channel, the DYDX price could reach the critical supports at $1.00, $0.80, and $0.60 as the technical indicator Relative Strength Index (14) stays below the 50-level.
Against Bitcoin, the dYdX is trading with a slight bullish candle below the 9-day and 21-day moving averages. The technical indicator Relative Strength Index (14) is moving below the 40-level which could decide the next direction of the market. Any bullish cross above the moving averages may hit the resistance level of 1400 SAT and above.
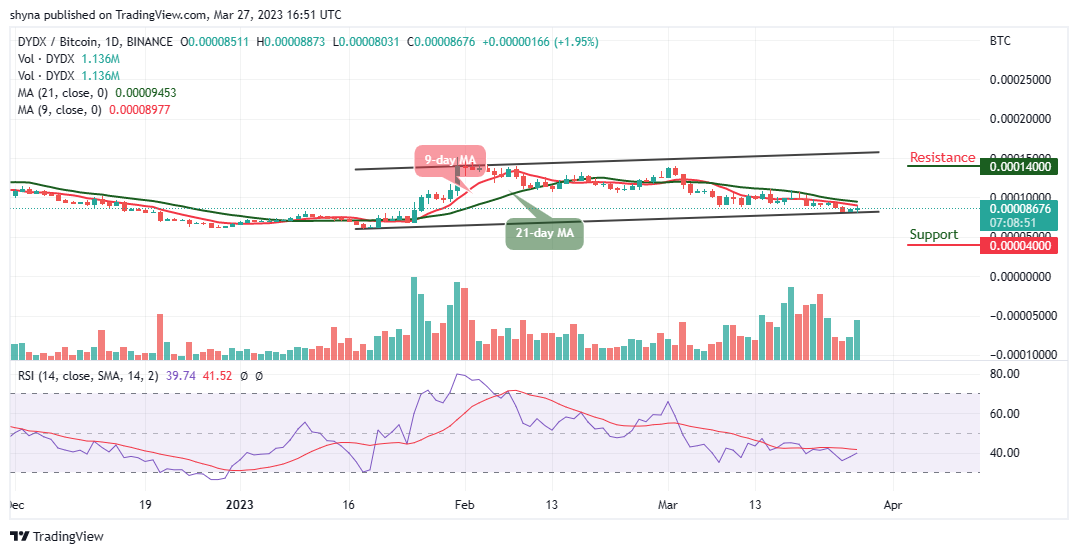
However, any form of retreat below the lower boundary of the channel could bring the coin to the support level of 4000 SAT and below. But buyers may need to gather enough momentum to push the market price to the north. For now, DYDX/BTC is moving sideways and may start rising once the technical indicator turns upward.
Alternatives to dYdX
The dYdX price is ranging within the channel, but if the coin spike above the 9-day and 21-day moving averages, it will be technically and fundamentally break above the resistance $3.0 level. Meanwhile, Love Hate Inu (LHINU) has proved to be one of the most promising tokens after effectively targeting the gaps in the vote-to-earn (V2E) Web3 technology to provide a customer-driven approach. Smart traders are to invest in LHINU as soon as possible to reap its many advantages for their physical and financial well-being as about $2 million has been raised so far in the ongoing presale.
Join Our Telegram channel to stay up to date on breaking news coverage