
Join Our Telegram channel to stay up to date on breaking news coverage
The Ripple price prediction shows that XRP is slightly pushing higher with 2.47% gains as the coin manages to face the north.
Ripple Prediction Statistics Data:
- Ripple price now – $0.45
- Ripple market cap – $23.7 billion
- Ripple circulating supply – 1.97 billion
- Ripple total supply – 99.98 billion
- Ripple Coinmarketcap ranking – #6
XRP/USD Market
Key Levels:
Resistance levels: $0.55, $0.57, $0.59
Support levels: $0.37, $0.35, $0.33
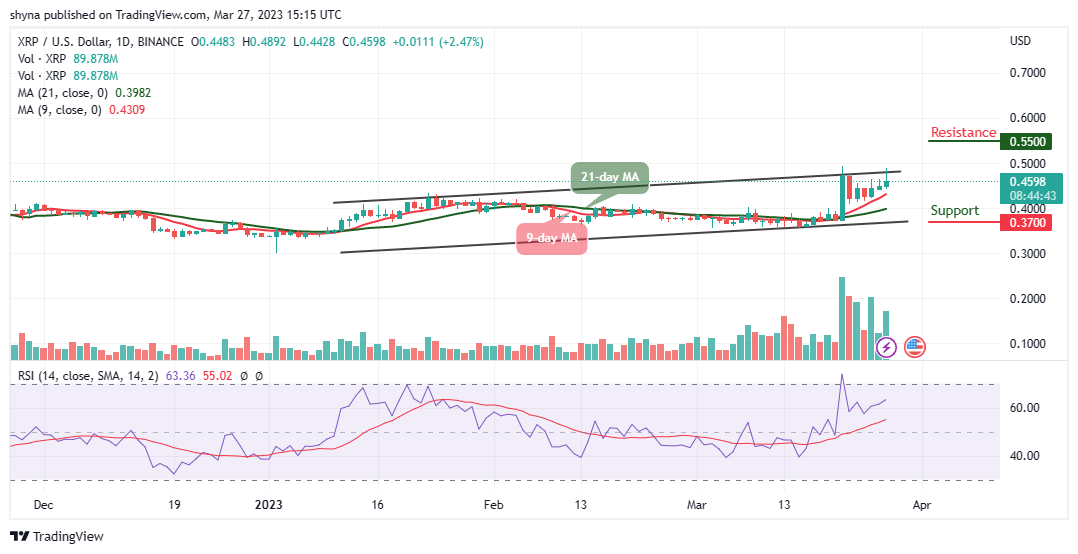
Looking at the daily chart, XRP/USD manages to reach a daily high of $0.44 as the market opens today. During the European session, the Ripple price is likely to cross above the upper boundary of the channel. However, any bullish cross above this barrier may allow the coin to create additional gains. Meanwhile, the current market movement shows that the buyers are likely to control the market.
Ripple Price Prediction: Ripple Price Heads to the Upside
At the time of writing, the Ripple price begins to follow the uptrend as the bull resume back into the market. Meanwhile, if XRP/USD sees a shift in momentum, the bulls may need to push the price above the 9-day and 21-day moving averages. The nearest resistance level could be established if there is a bullish breakout above the upper boundary of the channel could take XRP to the potential resistance levels of $0.55, $0.57, and $0.59 as the technical indicator Relative Strength Index (14) keeps moving above the 60-level.
At the time of writing, XRP/USD is trading at $0.45 which could touch the nearest resistance at $0.50. On the contrary, a bearish movement toward the lower boundary of the channel may cause the Ripple price to revisit the downside to hit the support levels of $0.37, $0.35, and $0.33 respectively.
Against Bitcoin, Ripple (XRP) is moving to cross above the upper boundary of the channel. The trend may continue to follow the bullish movement and could take the coin to higher levels.
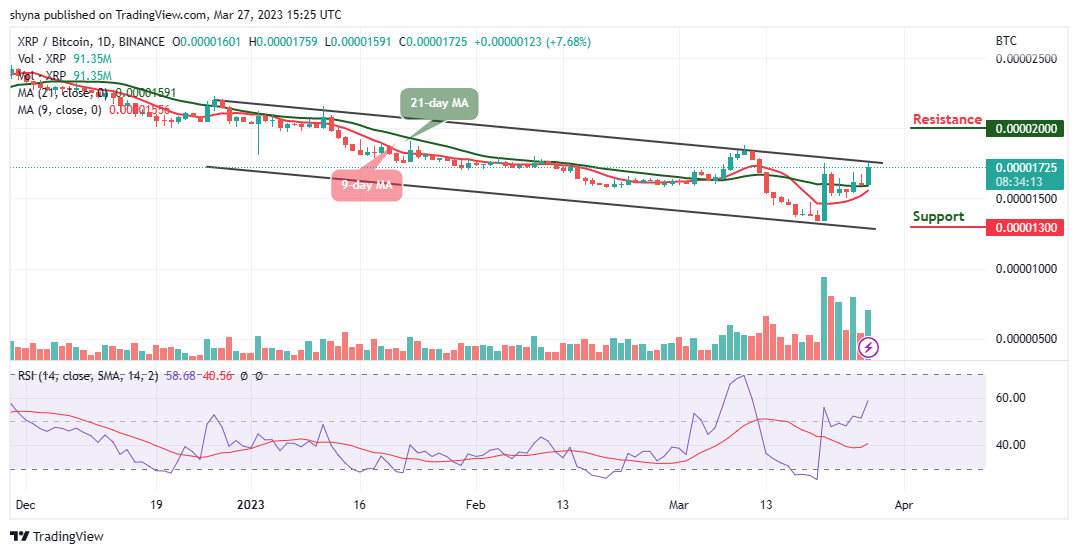
However, the resistance level could be found at 2000 SAT and above but any bearish movement below the 9-day and 21-day moving averages may bring the coin to the closest support level at 1300 SAT and below. Meanwhile, the technical indicator Relative Strength Index (14) is moving to cross above the 60-level, suggesting a bullish movement for the market.
Alternatives to Ripple
The daily chart shows that the Ripple price is getting ready for a bullish cross above the upper boundary of the channel, once this is done, the coin may hit the resistance level of $0.50. Meanwhile, bulls may need to increase the buying pressure so as to push the market price to the upside. On that note, there is a token with more promising in the market, the Love Hate Inu token is built on the reliable and secure Ethereum blockchain, and its presale is still on with nearly $2 million raised so far.
Join Our Telegram channel to stay up to date on breaking news coverage