Join Our Telegram channel to stay up to date on breaking news coverage
The dYdX price prediction is seen breaking above the $2.0 resistance level as DYDX trades bullishly toward the moving averages.
dYdX Prediction Statistics Data:
- dYdX price now – $2.0
- dYdX market cap – $323.5 million
- dYdX circulating supply – 156.2 million
- dYdX total supply – 1 billion
- dYdX Coinmarketcap ranking – #102
DYDX/USD Market
Key Levels:
Resistance levels: $3.5, $4.0, $4.5
Support levels: $0.8, $0.6, $0.4
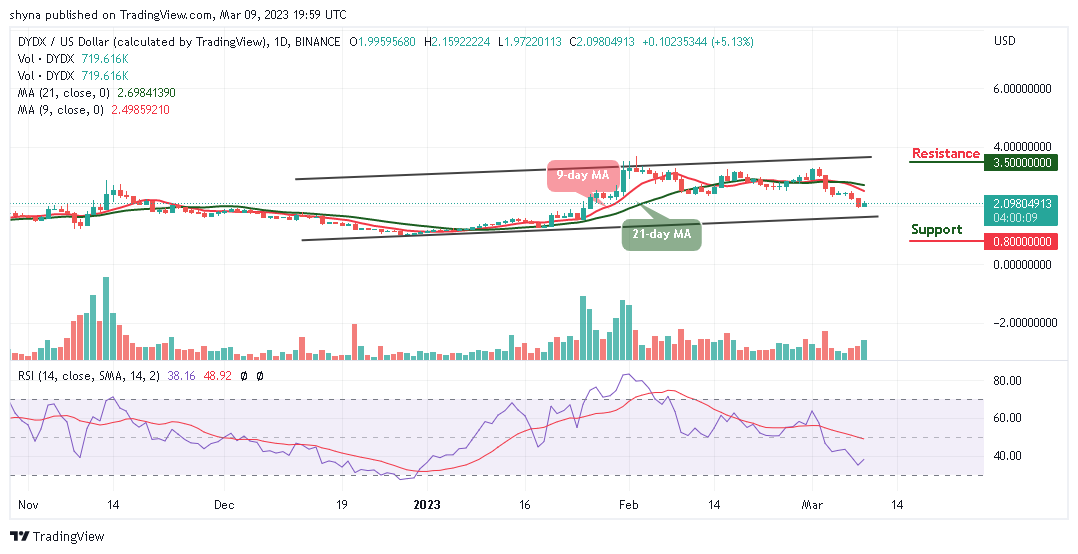
DYDX/USD is seen refreshing to a new daily high as the coin heads to the upside to trade close to the resistance level of $2.2. Meanwhile, the coin is currently trading at $2.0 with a bullish movement but has yet to cross above the 9-day and 21-day moving averages. On the contrary, if the dYdX price slides below the lower boundary of the channel, sellers could return to the market, but the bulls are likely to collect more on the price dips.
dYdX Price Prediction: dYdX (DYDX) Could Gain More Uptrends
The dYdX price can only begin the upward movement if the newly touched $2.15 resistance level is maintained at all costs. At the moment, the technical indicator Relative Strength index (14) is likely to cross above the 40-level as the signal line points to the north to encourage more buyers. However, dYdX (DYDX) can now begin to follow the uptrend as soon as the coin crosses above the moving averages.
Nonetheless, if the red line of the 9-day MA crosses above the green line of the 21-day MA, the dYdX price could perform well and may reach the resistance levels at $3.5, $4.0, and $4.5 respectively. Meanwhile, if the market price slides and faces south, there may be a bearish drop which could roll the coin down to the support levels of $0.8, $0.6, and $0.4 respectively.
Against Bitcoin, the dYdX price is hovering below the 9-day and 21-day moving averages as the price touches the daily high at 1012 SAT. However, the technical indicator Relative Strength Index (14) is crossing above the 40-level as the coin aims for more uptrends.
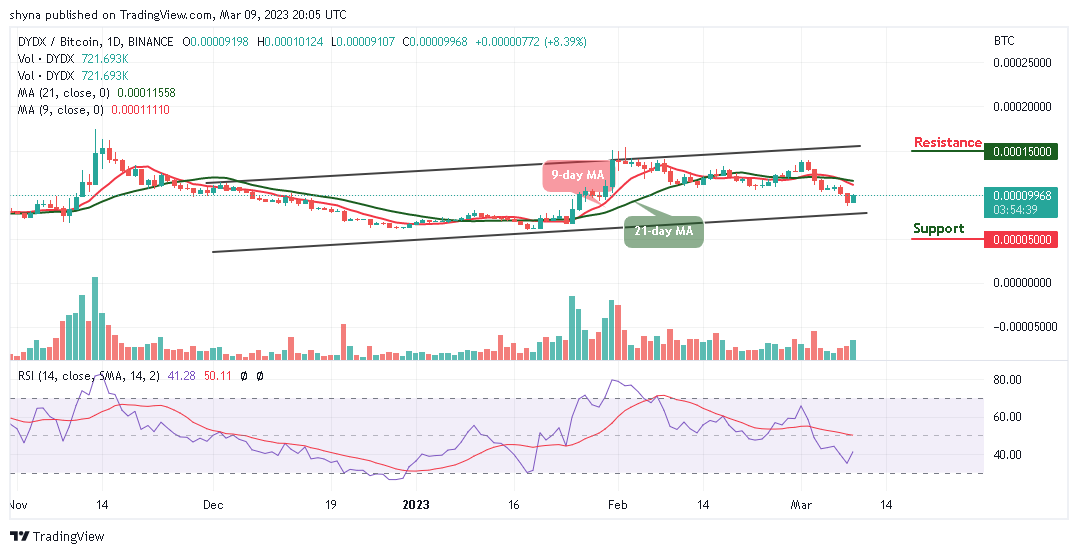
Moreover, the potential resistance level is located at 1500 SAT and above, but a lower sustainable move may cancel the bullish movement and could attract new sellers coming into the market with the next focus on the support level of 500 SAT and below.
dYdX Alternatives
At the moment, the bullish price is facing another resistance at the $2.5 price level and there is another price tussle at this level again. However, the higher number of traders ready to buy the crypto at this level is what is keeping the price pegged at its current position. Nevertheless, one of the benefits of making use of the FightOut token platform is that it gives you the opportunity to take part in investing in the projects at their earliest stages. FGHT token is successful; it has, so far, raised almost close to $5.5m.
Join Our Telegram channel to stay up to date on breaking news coverage