Join Our Telegram channel to stay up to date on breaking news coverage
This forecast will discuss price movements in the Polkadot versus USD and Polkadot versus BTC markets. We shall be analyzing the market to see what trading chances lie there in it. Furthermore, we can observe that price movements in the two markets seem alike, as both DOT/USD and DOT/BTC.
DOT Forecast Statistics Data:
DOT price now: $8.02
DOT market cap: $8.9 billion
DOT circulating supply: 1.10 billion
DOT total supply: 1.2 billion
DOT Coinmarketcap ranking: #11
Major Levels:
Ceiling levels: $8.02, $8.12, $8.70
Floor levels: $8.30, $8.00, $7.80
The two markets are performing impressively. More specifically, we can say the price is correcting from a downtrend. Nevertheless, let’s get into what the market holds advice for traders.
DOT Price Prediction: Polkadot is Rebounding Upwards
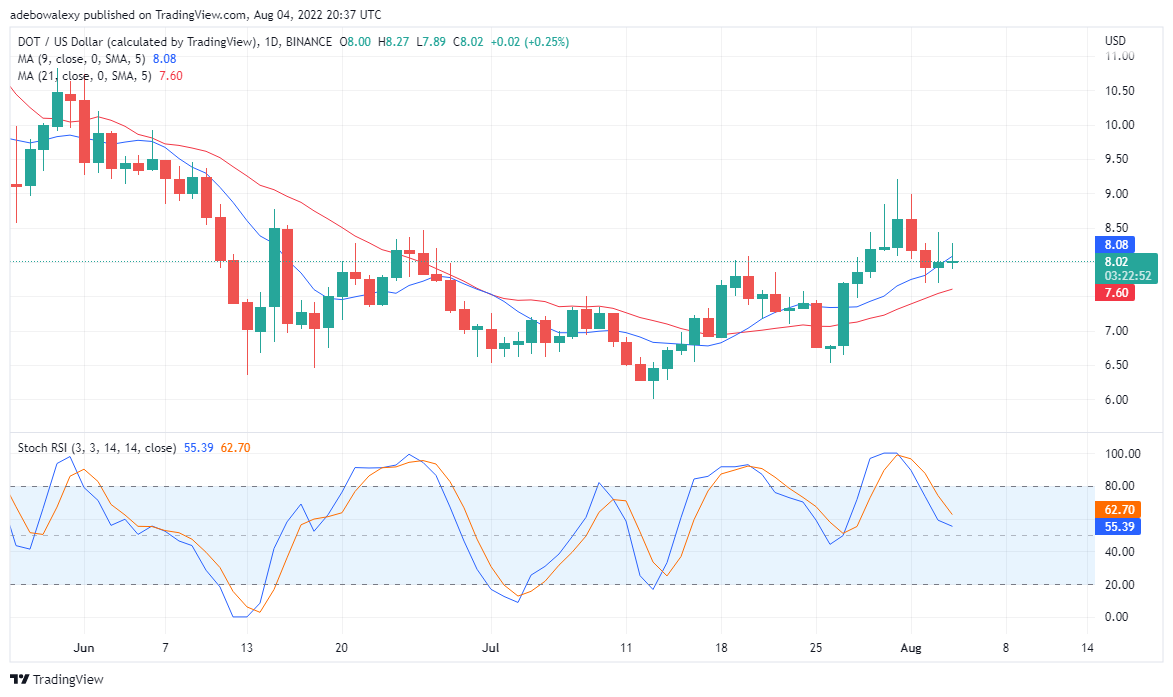
On the DOT/USD daily chart, although minimal selling pressure tried to pull the crypto down, buyers were quick to the rescue. Eventually, it looks as if buyers gradually pulling back the trend. Furthermore, the activities of buyers can be seen to have made the bullish price candle bounce off the EMA lines.
Also, the Stochastic RSI indicator seems to be foretelling a reversal of the trend. This can be seen in the behavior of the threads of this Indicator as it is attempting to cross on its way down. If this eventually happens Polkadot’s price may resume trending upwards. And, eventually, the value of DOT/USD mar reach around $9.00 and $9.50.
DOT Price Prediction: Polkadot Upward Gain Stays on
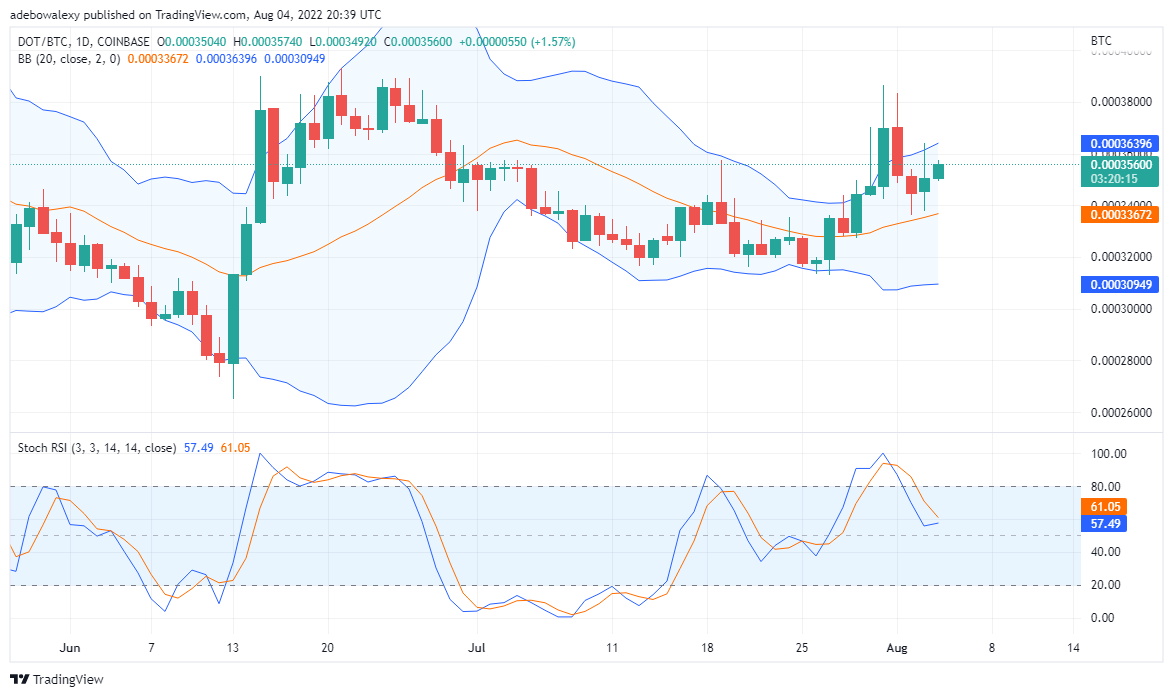
The DOT/BTC chart appears very similar to the DOT/USD chart. We can see here that the developing uptrend on the DOT/USD appears to have extended to this market. On this chart too, we can see that the price candlesticks pulled back from touching the middle layer of the Bollinger indicator. This implies that there was a pullback, a bit similar to what was seen on the DOT/USD. The implication of this is that an upward reversal has occurred.
Also, the Stochastic RSI indicator is almost touching each other for an upward cross. Eventually, if this happens, we may the DOT/USD value reach 0.0003800 and 0.0004000. Finally, it’s more likely that this will eventually occur. Therefore traders should anticipate these levels.
Join Our Telegram channel to stay up to date on breaking news coverage


