Join Our Telegram channel to stay up to date on breaking news coverage
The Dogecoin price prediction is dropping below the 9-day and 21-day moving averages after touching the daily high at $0.143.
DOGE/USD Market
Key Levels:
Resistance levels: $0.160, $0.170, $0.180
Support levels: $0.110, $0.100, $0.090
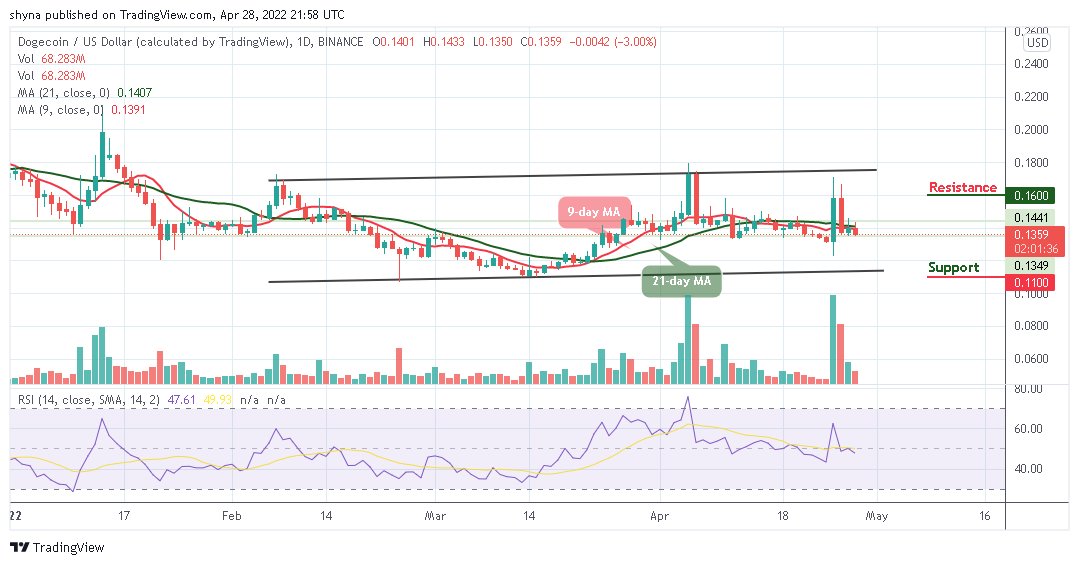
After touching the resistance level of $0.143 today, DOGE/USD is trading at $0.135. The coin is also moving within the channel and above the 9-day and 21-day moving averages, indicating an indecisive movement in the market. For the time being, the market price is moving towards the lower boundary of the channel as the trading volume is issuing a sell signal, while the technical indicator confirms the bearish movement.
Dogecoin Price Prediction: DOGE Price May Not Be Ready for Higher Levels
At the time of writing, the Dogecoin price is sliding below the channel as bulls couldn’t keep the coin at the upside. However, any attempt by the buyers to cancel the current bearish movement and push the Dogecoin price back above the 9-day and 21-day moving averages is likely for it to revisit the resistance level of $0.150.
Furthermore, any bullish movement above this level could lead the market to the crucial resistance levels at $0.160, $0.170, and $0.180. On the contrary, if the coin continues to drop towards the lower boundary of the channel, the DOGE price could reach the critical supports at $0.110, $0.100, and $0.090 as the technical indicator Relative Strength Index (14) nosedives below the 50-level.
DOGE/BTC Market: Consolidating to the Downside
Against Bitcoin, the Dogecoin is trading below the upper boundary of the channel with a bearish candle breaking below the 9-day and 21-day moving averages. The technical indicator Relative Strength Index (14) is moving to cross below the $50-level which could bring more bearish signals into the market. A further drop may likely hit the support level of 300 SAT and below.
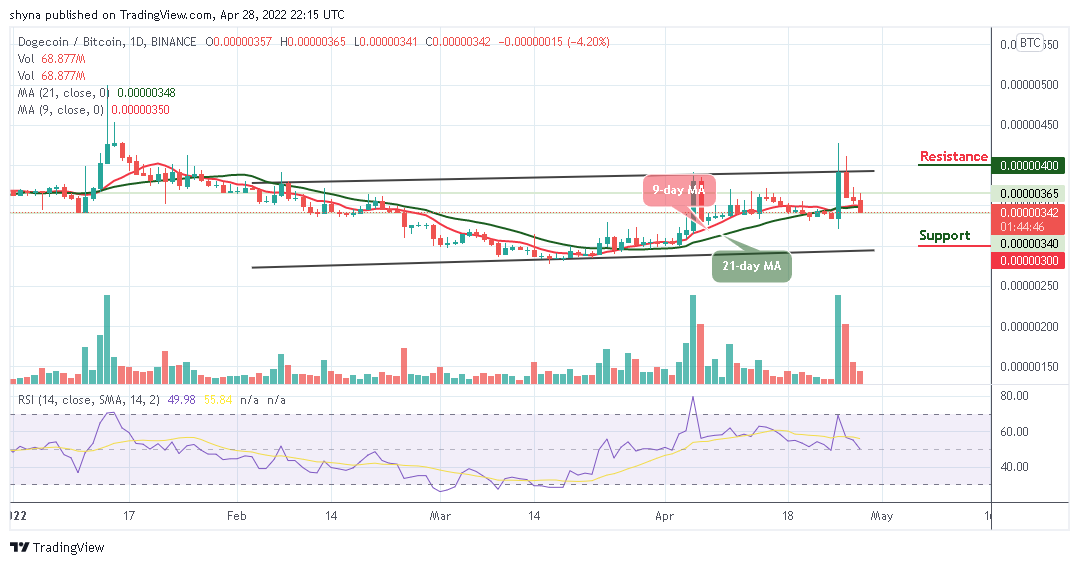
However, any form of a rebound from the current level at 342 SAT could push the coin to the resistance level of 400 SAT and above. But buyers may need to gather enough momentum to push the market price to the north. For now, DOGE/BTC is moving sideways and may start rising once the technical indicator turns upward.
Read more:
Join Our Telegram channel to stay up to date on breaking news coverage