Join Our Telegram channel to stay up to date on breaking news coverage
The Bitcoin price prediction shows that BTC is trading at $40,229 as the coin seems to be preparing for another upward movement.
BTC/USD Long-term Trend: Ranging (Daily Chart)
Key levels:
Resistance Levels: $44,000, $46,000, $48,000
Support Levels: $36,000, $34,000, $32,000
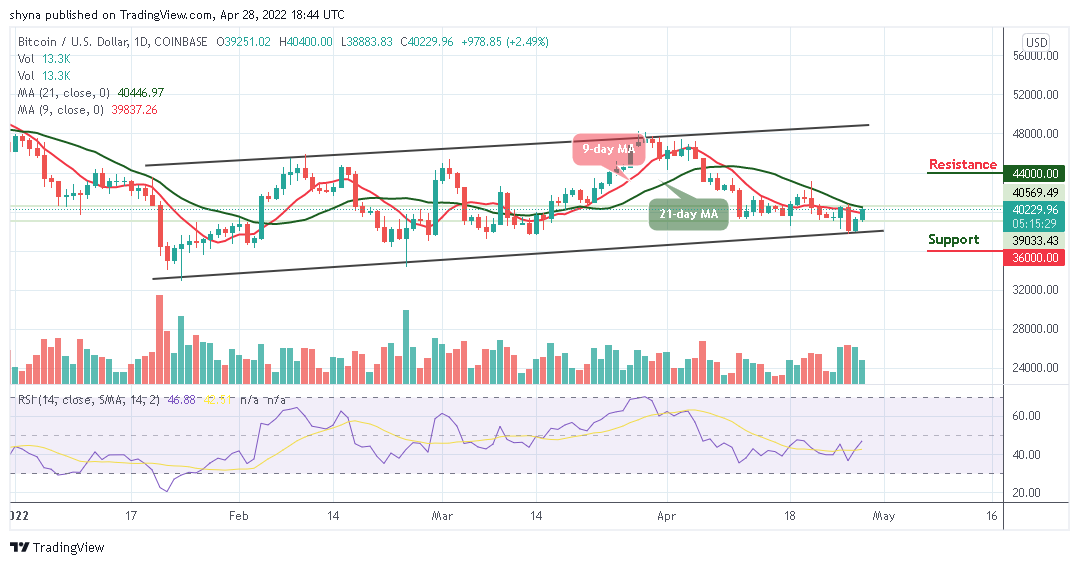
BTC/USD is trading towards the 9-day and 21-day moving averages at $40,229 as the coin prepares to gain additional higher levels. At the moment, the number one crypto is likely to extend towards the resistance level of $40,500 if the bulls put more pressure on the market.
Bitcoin Price Prediction: Is $40k Resistance Stable for BTC?
According to the daily chart, the Bitcoin price is yet to cross above the 21-day moving average, any further bullish movement above this barrier could locate the potential resistance levels at $44,000, $46,000, and $48,000. Typically, when the new uptrends are coming to the surface, traders may use the 9-day moving average as a pivot resistance point to gauge the strength of the trend. However, if BTC/USD begins to soar towards the upper boundary of the channel, this could be a sign of sustainability and may likely result in a bullish continuation.
Moreover, should the BTC price fail to move up; traders may see a price cut towards the lower boundary of the channel, and a further low could bring the price to the support levels at $36,000, $34,000, and $32,000 respectively. But as it stands, the Bitcoin price is likely to rise as the technical indicator Relative Strength Index (14) moves to cross above 50-level.
BTC/USD Medium-Term Trend: Ranging (4H Chart)
Looking at the 4-hour chart, the market has been following a sideways movement for the past few days as the bulls are trying to come back into the market by defending the $39,000 level. If not, the support level of $38,000 and below may come into play.
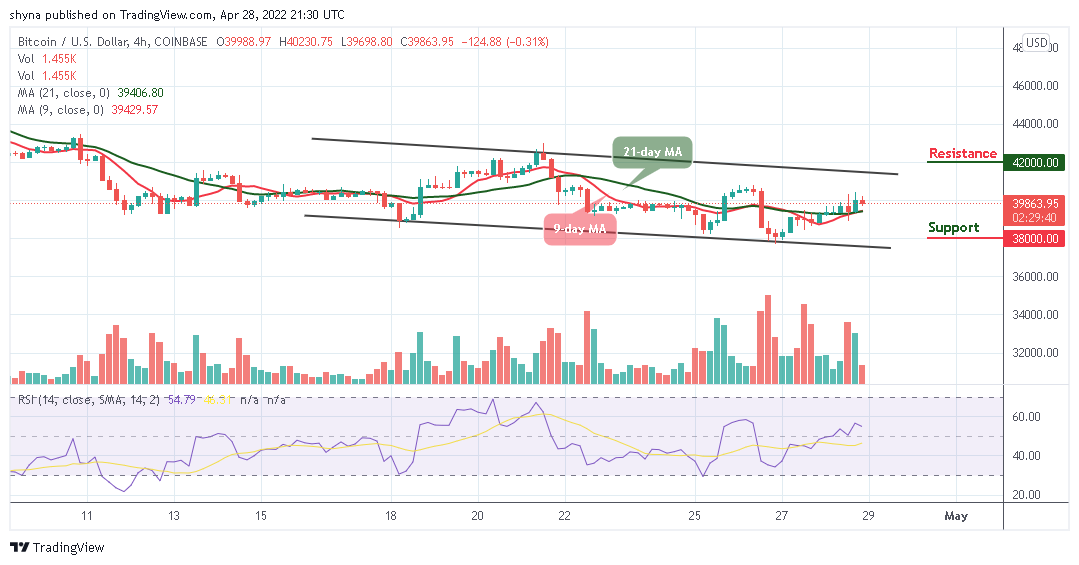
However, if the bulls keep the market above the 9-day and 21-day moving averages, traders may expect a retest of the $40,000 resistance level, and breaking this level may further push the price towards the resistance level of $42,000 and above as the technical indicator Relative Strength Index (14) remains above 50-level, suggesting sideways movement.
Looking to buy or trade Bitcoin (BTC) now? Invest at eToro!
68% of retail investor accounts lose money when trading CFDs with this provider
Read more:
- How to buy Bitcoin
- How to buy Cryptocurrency
Join Our Telegram channel to stay up to date on breaking news coverage