Join Our Telegram channel to stay up to date on breaking news coverage
DASH Price Analysis – April 23
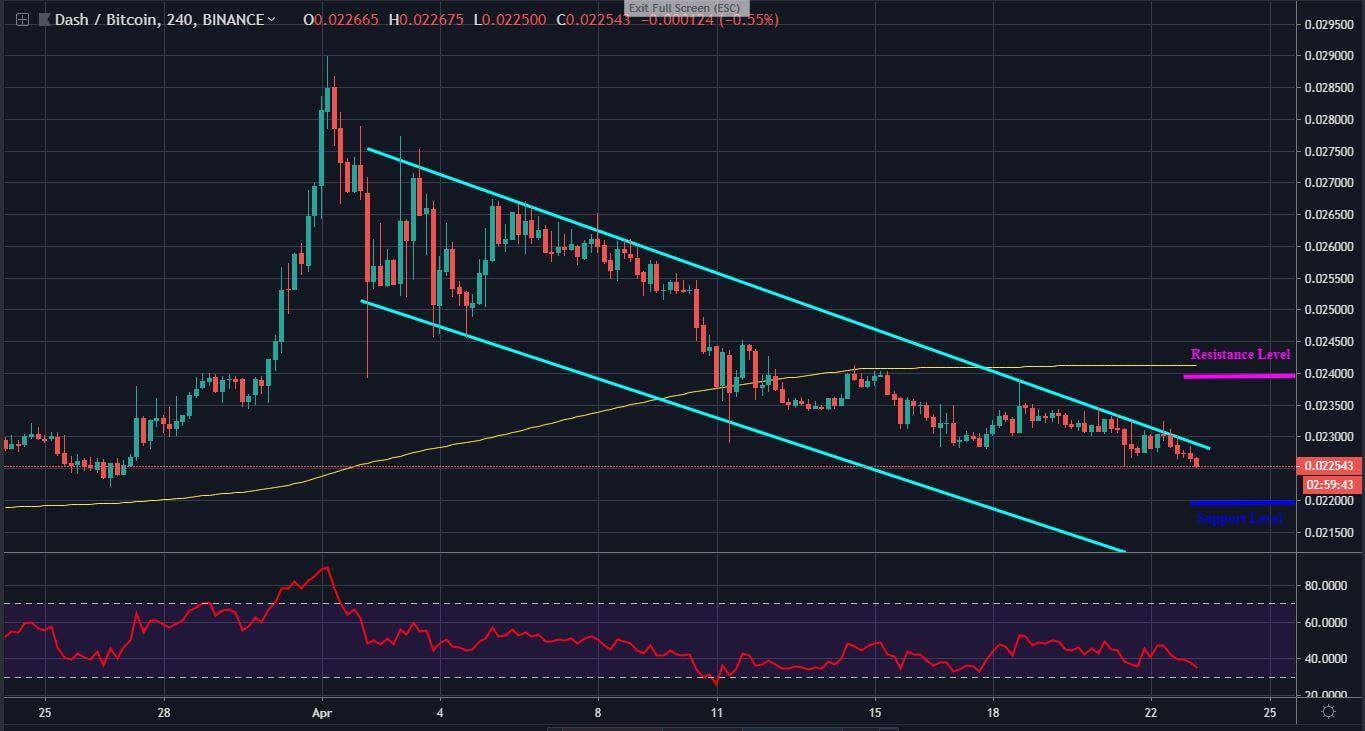
After April short position, DASH market had been following a bearish sentiment. Crossing down the 200-day MA, DASH/BTC nears a key support level of 0.022 BTC. Despite the fall, the 200-day MA still acts as a defensive line for DASH/USD pair. However, both markets respect a falling channel.
DASH/USD Market
Key Levels:
Resistance levels: $135, $145
Support levels: $115, $100
The price of DASH had been falling for the past weeks due to the selling pressure in the market. As a result of this, the market has been down by roughly 18% as price currently trades at $123 level. The volatility of the cryptocurrency appeared low with choppy price action.

Following the medium-term bearish correction, DASH is still respecting the bulls’ defensive line; the 200-day moving average line (yellow). Meanwhile, the $125 price level has been holding the bulls for the past twelve days. A successful breach might take price to $130.
As shown on the RSI, the trend is positioned at 56.8 level. The next major resistance is at $135 level which is outside the channel. A bearish move could slump price to $115support.
DASH/BTC Market
While staying above the important 200-day moving average line (yellow) in late March, DASH price rose to the peak of 0.029 BTC high before plunging in a channel. Testing the yellow line on April 12, a significant break has further led the bears far below the yellow line.

Currently, the cryptocurrency exchanges are heading towards the March support at a 0.022 BTC level. At the test of the mentioned support, a possible bounce up may occur for a bullish reversal. If a bounce up fails, a break down could further the trend in a more bearish condition.
The medium-term RSI is now trending below the 50 level after the price drop on April 1. A successful break up could kick-start a bull-run at 0.024 BTC resistance level, testing the important yellow line.
Please note: insidebitcoins.com is not a financial advisor. Do your own research before investing your funds in any financial asset or presented product or event. We are not responsible for your investing results.
Join Our Telegram channel to stay up to date on breaking news coverage

