Join Our Telegram channel to stay up to date on breaking news coverage
The Quant market has been in long-term market indecision. The market entered this price movement pattern in early August. But as we get into the middle of September, the consolidation price pattern became stronger as the support and resistance levels converge more. Towards the end of September, the price began a steady ascension to the upside on each of the day’s trading sessions.
Quant Market Price Statistic:
- QNT/USD price now: $215.99
- QNT/USD market cap: $2,581,129,125
- QNT/USD circulating supply: 12,072,738.00
- QNT/USD total supply: 14,612,493
- QNT/USD coin market ranking: #28
Key Levels
- Resistance: $ 240.00 $245.00 $250.00
- Support: $200.00 $190.00 $185.00
Your capital is at risk
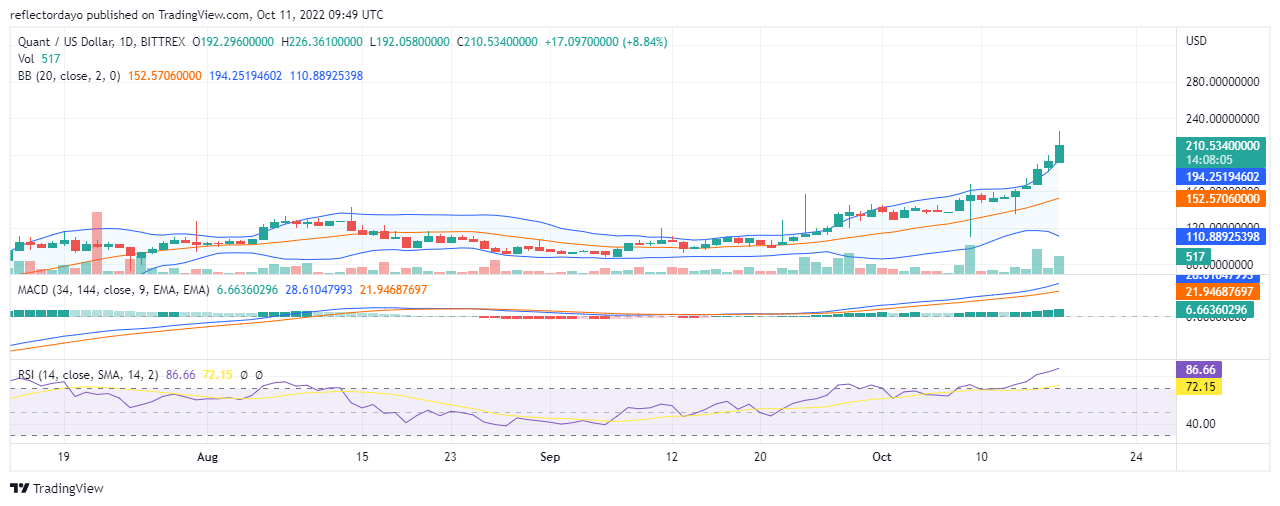
Quant Market Price Analysis: The Indicators’ Point of View
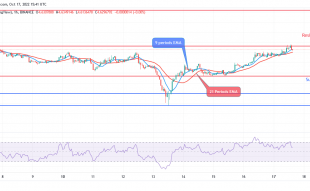
The volume of trade in the QNT/USD market began to increase on the 8th of October. And as a result of this, the market volatility became high on the 9th of October when bears brought the price as low as $111. However, the bulls recovered the price on that same day, pushing the price to the height of $168, and then they settled the price at $156.2 as the day’s trading session closed. Due to the increase in traders’ interest to buy and sell in the QNT/USD market, the bands of the Bollinger diverge, creating more room for the price action to perform.
Both the Bollinger indicator and the RSI indicator are telling us that the price action has entered the overbought region. We should expect a retracement of the price.
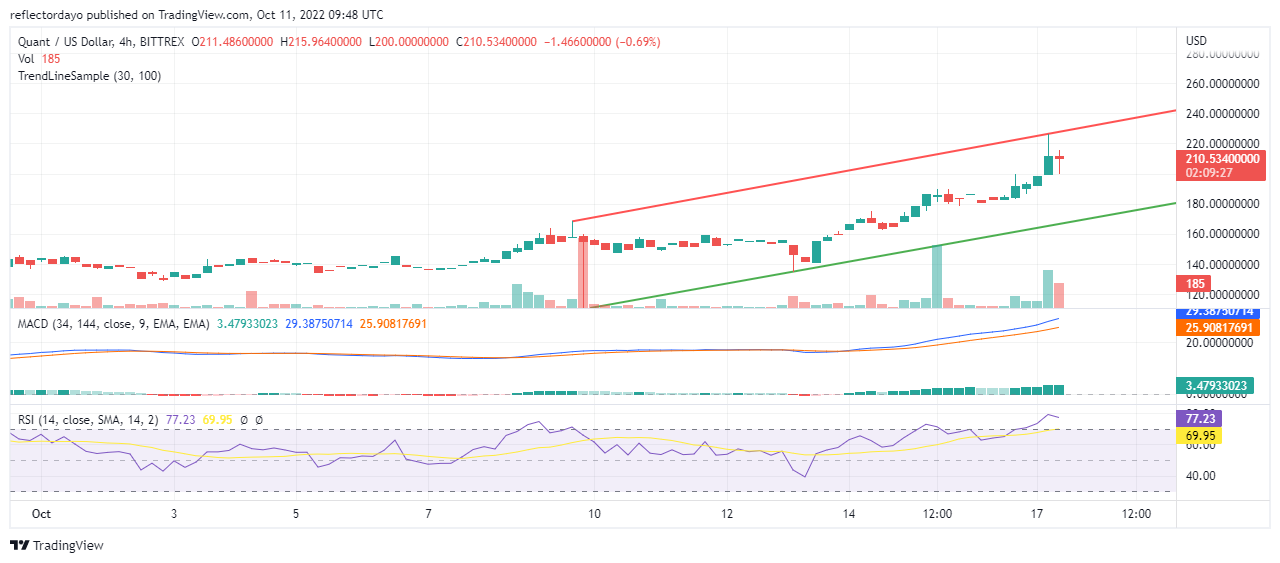
QNT/USD 4-Hour Chart Outlook
From the 4-hour session outlook, the bullish trend still appears to be strong. it is looking like the bulls are becoming stronger to minimize or prevent the expected price retracement. But the RSI line is still in the overbought moving at 77%. The price pullback may take place soon before which the bullish trend may resume.
Join Our Telegram channel to stay up to date on breaking news coverage