Join Our Telegram channel to stay up to date on breaking news coverage
The buyers started on a strong note today as trading activities of CHZ/USD opened with very strong buying pressure. The bullish momentum aims at breaking the $0.23292657 resistance. However, along the line, selling pressure became so strong that the price dropped below the bullish opening price. At the moment, the sellers are even more aggressive to take control of the market than the buyers.
Chiliz Price Statistic:
- CHZ/USD price now: $0.21636380
- CHZ/USD market cap: $1,295,603,932
- CHZ/USD circulating supply: 6.00Billon
- CHZ/USD total supply: 8,888,888,888
- CHZ/USD coin market ranking: #41
Key Levels
- Resistance: $0.22165003, $0.24288438, $0.25000000
- Support: $0.18661334, $0.16219582, $0.1500000
Your capital is at risk
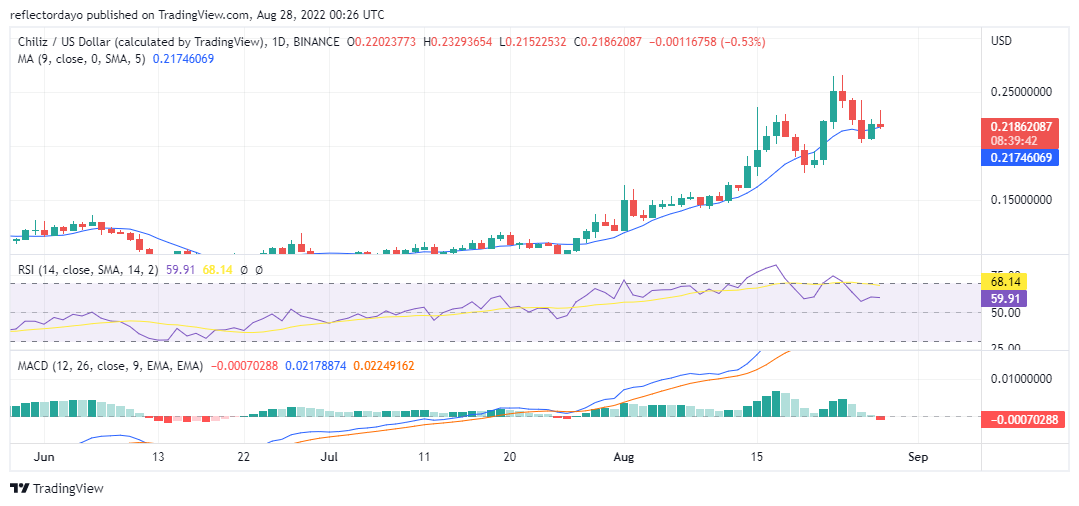
Chiliz Price Analysis: The Indicators Point of View
Judging from the outlook of the indicators, Chiliz is still in the uptrend zone. It is even possible that the market may eventually favour buyers at the end of the day. The signal line of the RSI still ranges at 68.16% which is at the threshold of the overbought region, while the RSI line, corrected itself from the overbought region to range briefly at 60%. The MACD indicators still hold a bullish trend. The two lines are still far away from each other, although, the outlook of the tiny histograms shows a weakening trend. Traders who would like to place a long or short trade should wait for more confirmations from the indicators and the price actions before they do so.
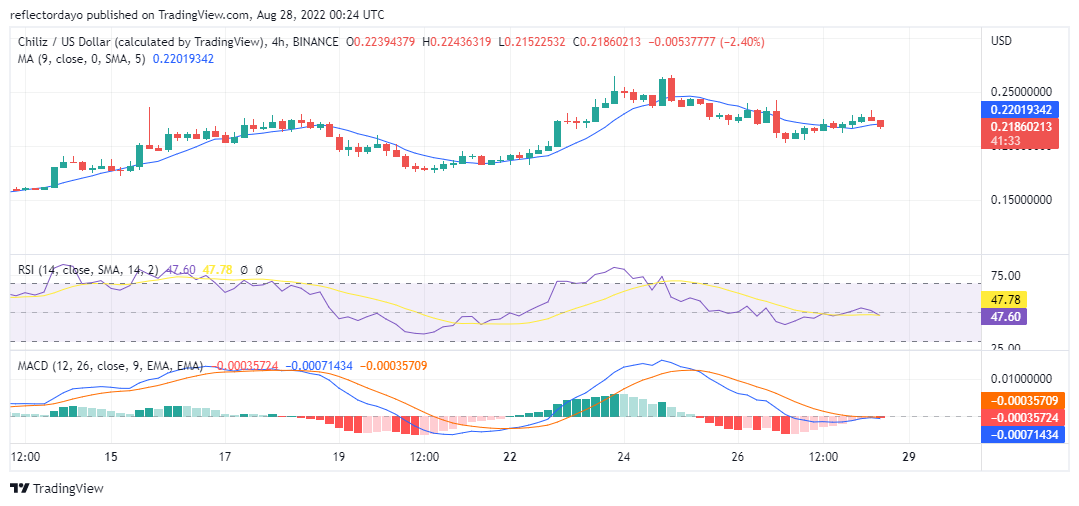
Chiliz Price Analysis: CHZ/USD 4-Hour Chart Outlook
Here, the indicators are pointing to a midrange market performance. The two lines of the indicators are at the middle point ranging between the upswing market and the downswing market. Likewise in the MACD indicator, the two lines are moving together with the flat histogram (all three) at point zero. This signifies a tug-of-war that left the market undecided about the market price direction for the trading session.
Related
Join Our Telegram channel to stay up to date on breaking news coverage