Join Our Telegram channel to stay up to date on breaking news coverage
Sellers’ pressure increases in Chiliz market
Chiliz (CHZUSD) Price Analysis – October 03
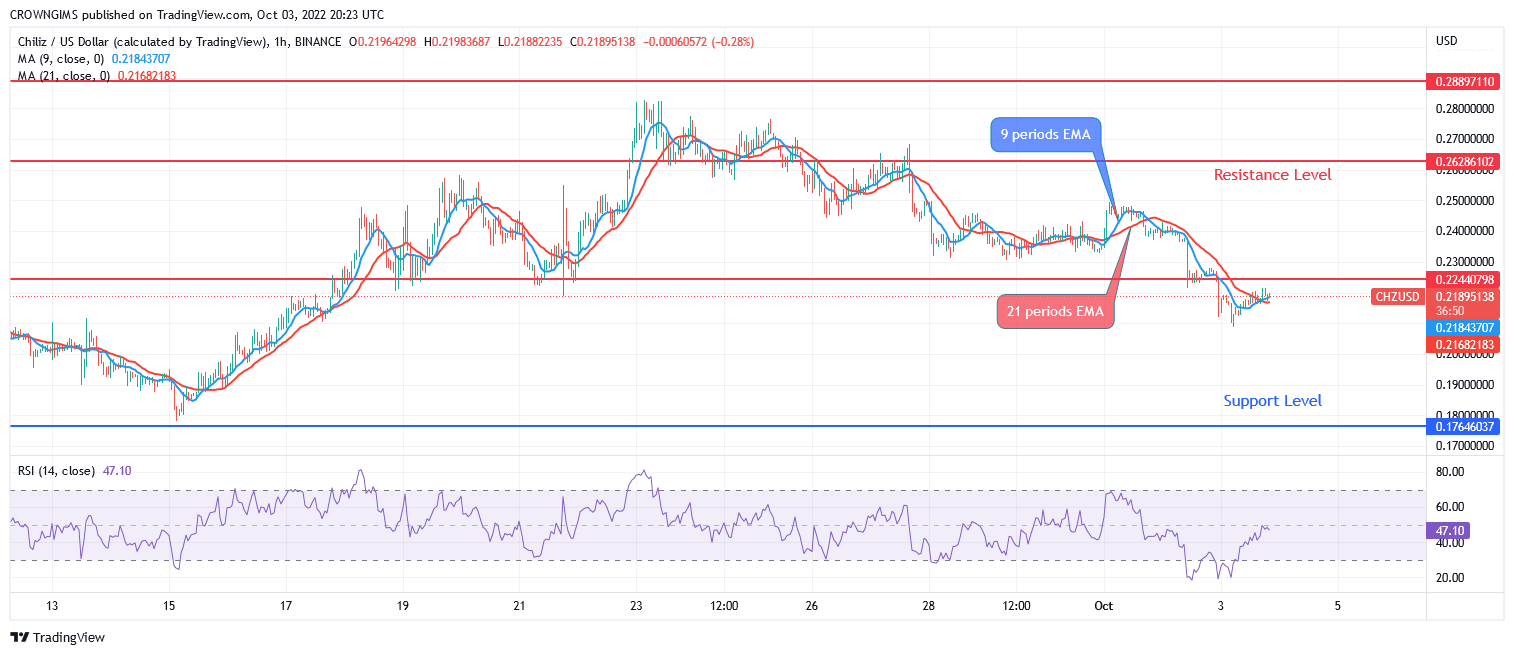
In case sellers put in more asset the key support level of $0.17 may be broken downside and the low of $0.13 and $0.10 may be reached. When buyers increase their momentum, resistance level of $0.22 may be broken upside then, $0.26 and $0.28 levels may be tested; Chiliz
CHZ/USD Market
Key Levels:
Resistance levels: $0.22, $0.26, $0.28
Support levels: $0.17, $0.13, $0.10
CHZUSD Long-term Trend: Bearish
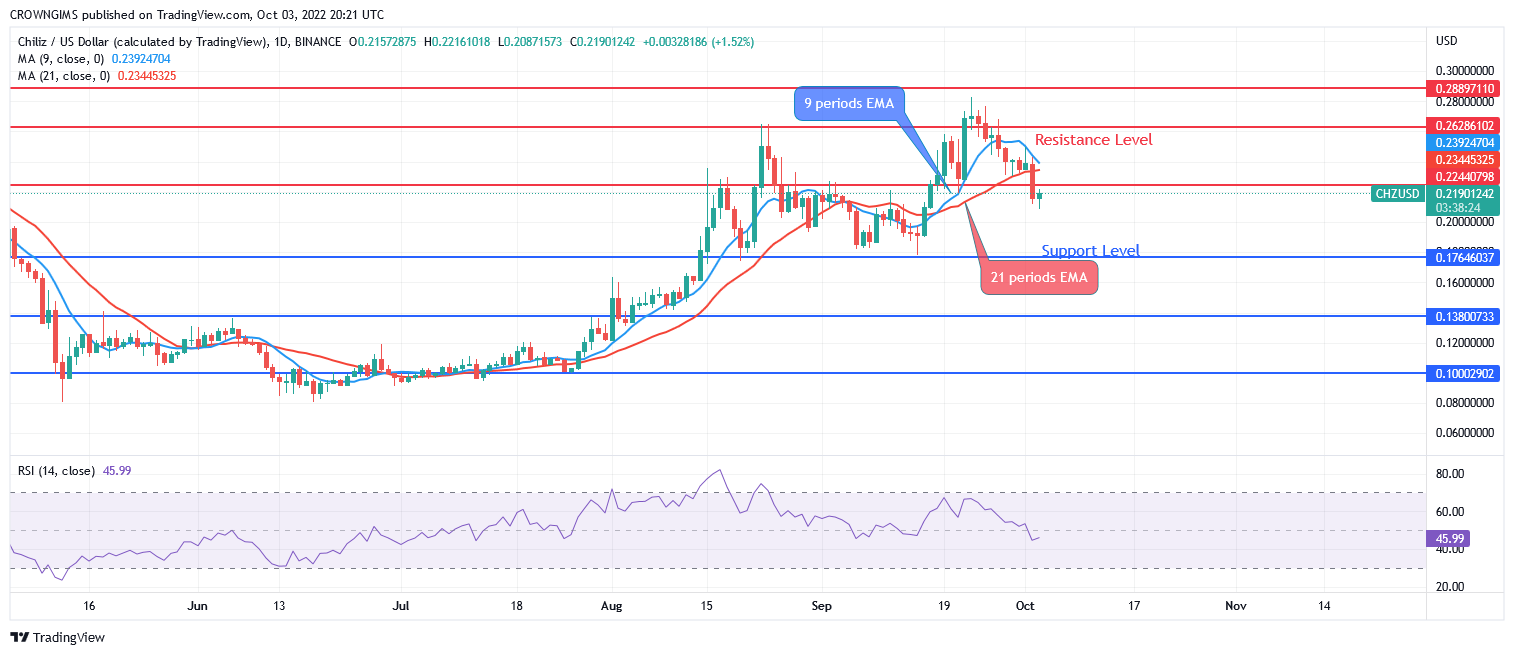
Chiliz is under sellers’ control. The price bottomed at the support level of $0.10. The price consolidate for many days at the same level. The bulls gained momentum and push the price to break up the resistance levels of $0.13 and $0.17. It pulled back and retest the $0.17. The price broke up the resistance level of $0.22 and tested the resistance level of $0.28 on September 23. The price is pulling back at the moment.
The daily chart has shown that sellers are dominating the market. The price action has formed a double top chart pattern on the daily chart. At the moment, the price is carrying out retracement. In case sellers put in more asset the key support level of $0.17 may be broken downside and the low of $0.13 and $0.10 may be reached. When buyers increase their momentum, resistance level of $0.22 may be broken upside then, $0.26 and $0.28 levels may be tested. The Relative Strength Index (14) is at 45 level pointing down to indicate sell signal.
Your capital is at risk
CHZUSD Medium-term Trend: Bearish
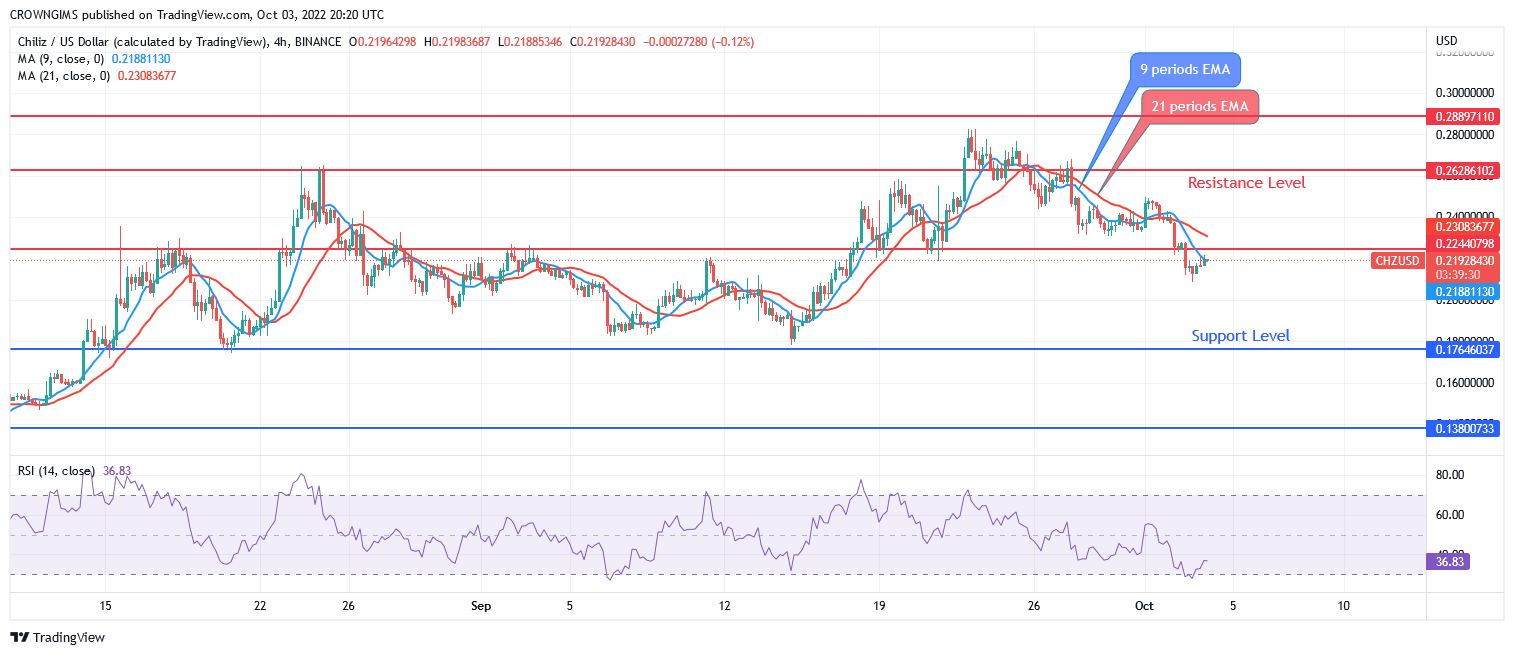
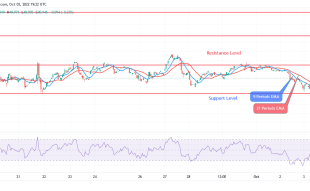
Chiliz is bearish in the 4-hour chart pattern. The crypto performance has been under the bulls’ pressure in the 4 hour chart. After the breakout from the long time consolidation. The price steadily increase. The resistance level of $0.28 was tested on September 23. The sellers’ pressure rejected the increase and it is currently pulling back.
The price is trading below 9 periods EMA and 21 periods EMA as an indication that the sellers are in control. The Relative Strength Index period (14) bend up at 37 level indicating buy signal.
Join Our Telegram channel to stay up to date on breaking news coverage
