

Join Our Telegram channel to stay up to date on breaking news coverage
The Chainlink price prediction sees a 10.60% price increase over the past 24 hours of trading as the cryptocurrency touches $6.82.
Chainlink Prediction Statistics Data:
- Chainlink price now – $6.80
- Chainlink market cap – $3.6 billion
- Chainlink circulating supply – 556.8 million
- Chainlink total supply – 1 billion
- Chainlink Coinmarketcap ranking – #19
LINK/USD Market
Key Levels:
Resistance levels: $8.0, $8.5, $9.0
Support levels: $5.0, $4.5, $4.0
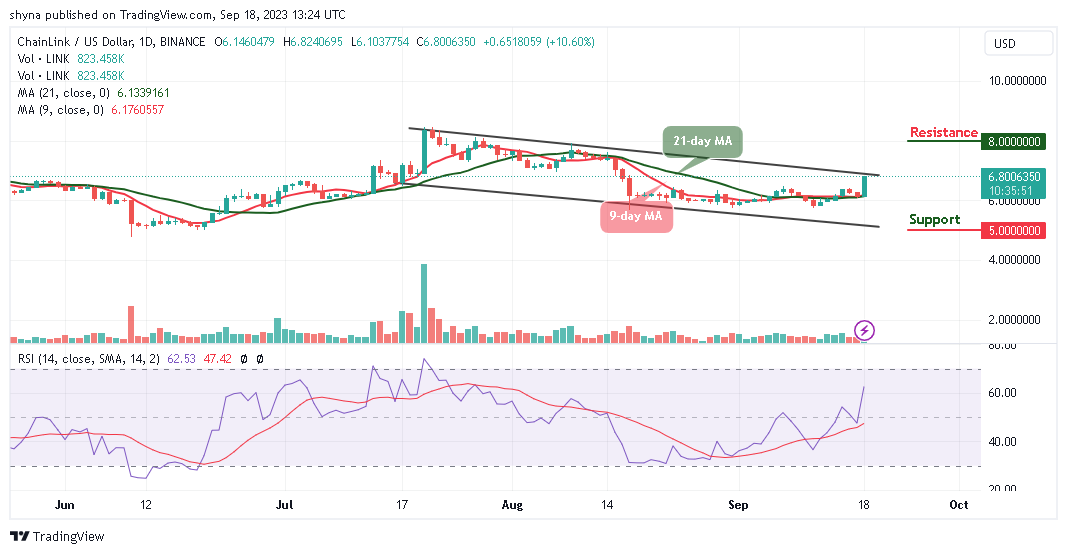
LINK/USD spikes to the upside as the coin gains a 10.60% price rise over the past 24 hours of trading. However, the Chainlink price may continue with the bullish movement if the red line of the 9-day MA crosses above the green line of the 21-day MA. At the time of writing, the current movement is shifting in the bullish favor, with the technical indicator Relative Strength Index (14) crossing above the 60-level.
Chainlink Price Prediction: LINK/USD Ready for a Spike above $7.0 Level
The Chainlink price may need to rise above $7.0 if the buyers push the price above the upper boundary of the channel. On the contrary, traders may consider the market as bearish if the sellers bring the market movement to the lower side.
Nevertheless, if the coin heads toward the upside, the first level of resistance lies at $7.5, while the potential resistance levels lie at $8.0, $8.5, and $9.0. Moreover, if the sellers bring the price toward the lower boundary of the channel, traders may expect supports to be located at $5.0, 4.5, and $4.0 while the technical indicator Relative Strength Index (14) faces the north to give more bullish signals.
LINK/BTC Heads to the North
Against Bitcoin, Chainlink is trading above the 9-day and 21-day moving averages. The Chainlink price is likely to cross above the upper boundary of the channel. From the above, the nearest resistance level is likely to touch 2600 SAT. Above this, higher resistance lies at 2800 SAT and above.
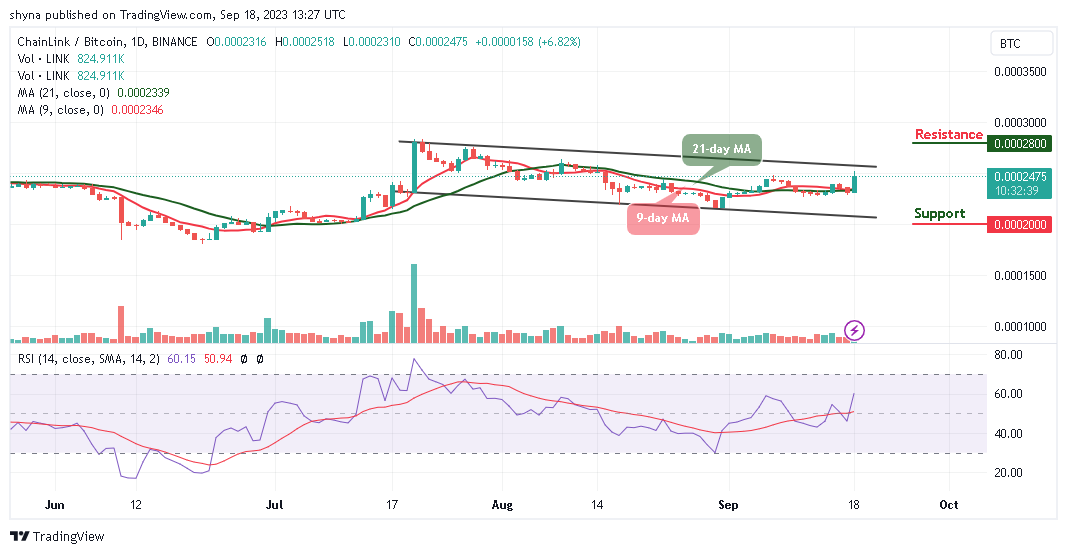
On the other hand, if the selling pressure creates a fresh low, lower support may be found at 2000 SAT and below. The technical indicator Relative Strength Index (14) moves to cross above the 60-level, which shows that the market may be preparing for an uptrend.
Chainlink Alternatives
The Chainlink price may remain on the positive side if the 9-day moving average crosses above the 21-day moving average. However, the technical indicator Relative Strength Index (14) also confirms the bullish movement as the signal line crosses above the 50-level.
Nevertheless, what sets Wall Street Memes apart from the other meme coins that are flooding the space is the project’s impressive pedigree. Meanwhile, with almost $25 million raised, the token increases, which means it’s important for investors to move quickly and secure the best price before the official launch date.
New OKX Listing - Wall Street Memes

- Established Community of Stocks & Crypto Traders
- Featured on Cointelegraph, CoinMarketCap, Yahoo Finance
- Rated Best Crypto to Buy Now In Meme Coin Sector
- Team Behind OpenSea NFT Collection - Wall St Bulls
- Tweets Replied to by Elon Musk
Join Our Telegram channel to stay up to date on breaking news coverage