
Join Our Telegram channel to stay up to date on breaking news coverage
The Chainlink price prediction shows that LINK is recovering from the daily opening price at the $6.91 level as the price heads to the upside.
Chainlink Prediction Statistics Data:
- Chainlink price now – $8.11
- Chainlink market cap – $4.36 billion
- Chainlink circulating supply – 538.1 million
- Chainlink total supply – 1 billion
- Chainlink Coinmarketcap ranking – #21
LINK/USD Market
Key Levels:
Resistance levels: $9.30, $9.50, $9.70
Support levels: $5.80, $5.60, $5.40
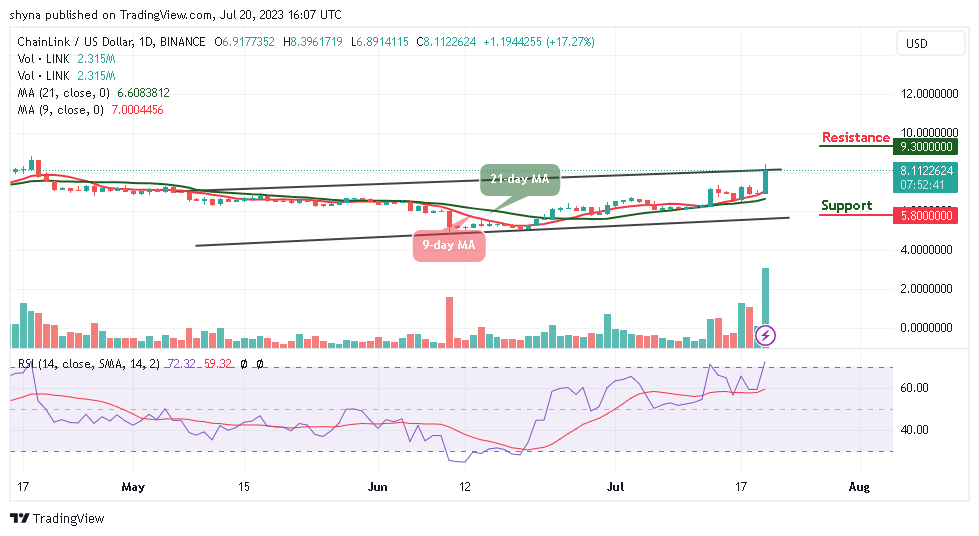
LINK/USD is trading above the 9-day and 21-day moving averages as the coin touches the daily high at the $8.39 resistance level. At the time of writing, Chainlink is changing hands at $8.11, having gained over 17.24% since the beginning of the European session. However, with latest the recovery, the digital asset is likely to cross above the upper boundary of the channel to increase the bullish movement.
Chainlink Price Prediction: Can Chainlink (LINK) Break Above $9.00?
The Chainlink price stays above the 9-day and 21-day moving averages at the price level of $8.11. However, if the bulls maintain the upward trend, LINK/USD may touch the resistance levels of $9.30, $9.50, and $9.70 to keep the price on the upside. In other words, any strong selling pressure below the 21-day moving average may drag the price toward the lower boundary of the channel.
However, should in case Chainlink trades below the lower boundary of the channel, a bearish continuation could bring the price to the supports of $5.80, $5.60, and $5.40. Meanwhile, the technical indicator Relative Strength Index (14) is moving to cross into the overbought region, indicating a bullish movement.
When compares with Bitcoin, the Chainlink price is heading to the north as the coin moves above the 9-day and 21-day moving averages. However, following the recent positive sign, the current market movement may continue to follow upward movement if the buyers push the price above the upper boundary of the channel.
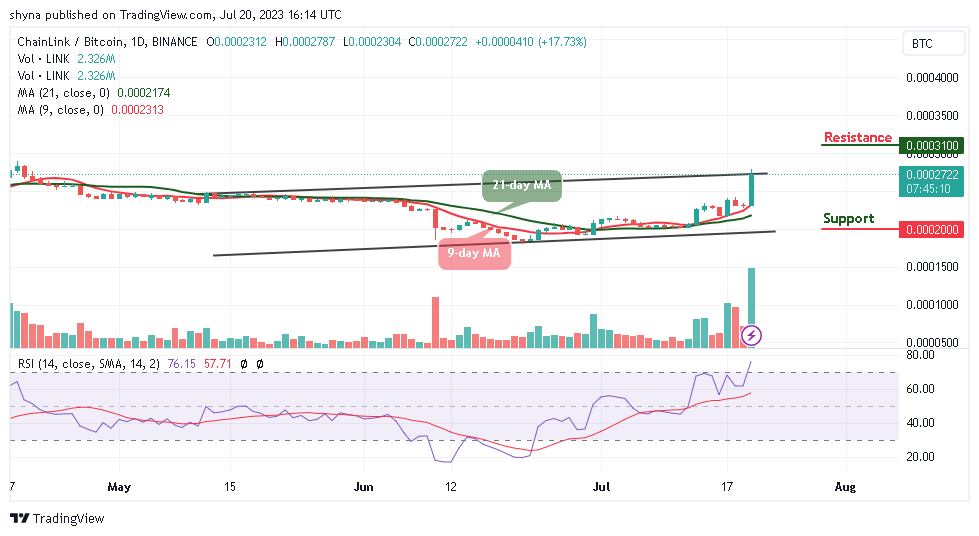
Moreover, as the technical indicator, Relative Strength Index (14) moves into the overbought region, the market price could hit the resistance level of 3100 SAT and above. Meanwhile, a retest below the moving averages could lower the price to the support level of 2000 SAT and below.
Alternatives to Chainlink
Looking at the daily chart, the Chainlink price is ready to break more upsides as the 9-day moving average moves to cross above the 21-day moving average. However, the more the bulls pressurized the bears, the higher the coin would reach.
Nevertheless, what sets Wall Street Memes apart from the other meme coins that are flooding the space is the project’s impressive pedigree. Meanwhile, with almost $17 million raised, the token increases, which means it’s important for investors to move quickly and secure the best price.
New OKX Listing - Wall Street Memes

- Established Community of Stocks & Crypto Traders
- Featured on Cointelegraph, CoinMarketCap, Yahoo Finance
- Rated Best Crypto to Buy Now In Meme Coin Sector
- Team Behind OpenSea NFT Collection - Wall St Bulls
- Tweets Replied to by Elon Musk
Join Our Telegram channel to stay up to date on breaking news coverage