Join Our Telegram channel to stay up to date on breaking news coverage
The Chainlink price prediction may continue to settle above the 9-day and 21-day moving averages as the coin heads to the upside.
Chainlink Prediction Statistics Data:
- Chainlink price now – $8.19
- Chainlink market cap – $4 billion
- Chainlink circulating supply – 507.9 million
- Chainlink total supply – 1 billion
- Chainlink Coinmarketcap ranking – #21
LINK/USD Market
Key Levels:
Resistance levels: $9.20, $9.40, $9.60
Support levels: $6.80, $6.60, $6.40
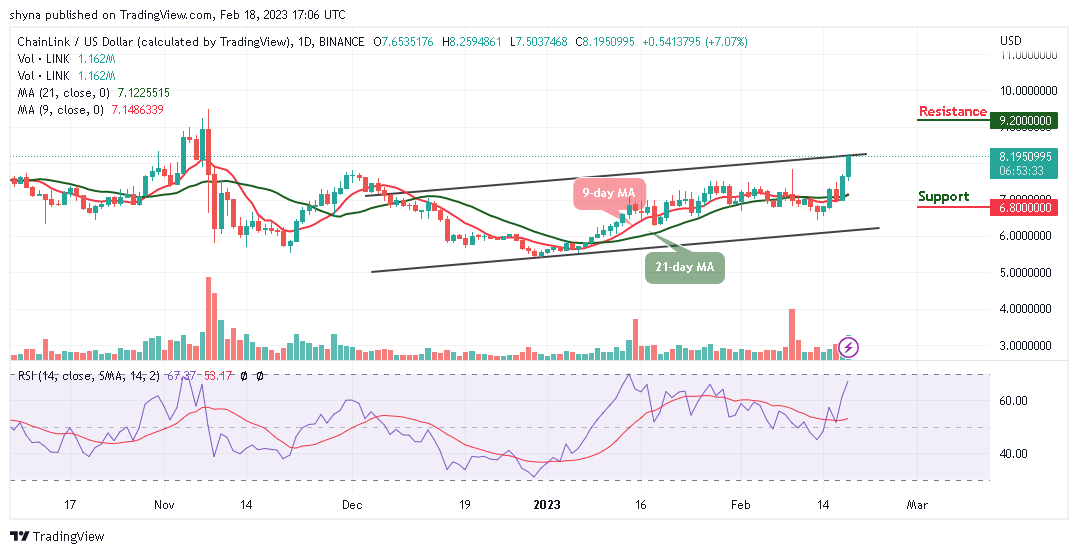
Looking at the daily chart, LINK/USD continues to trade above the 9-day and 21-day moving averages within the channel. However, the cryptocurrency is now trying to create a higher ground above the resistance level of $8.50, and should the buyers keep the coin above the moving averages, it may remain on the upside. Today, an early trading session makes the Chainlink price touch the $9.0 level before rebounding to where it is trading currently at $8.19.
Chainlink Price Prediction: What Could be the Next Direction for Chainlink?
The Chainlink price may stay above the moving averages and if the resistance of $8.50 gives way, the bull run may come to focus, and the coin may create an additional bullish trend. Now, the bullish scenario seems to surface as buyers continue to post firm commitments into the market. According to the daily chart, traders could see a sharp rise in the market price. Therefore, if the coin reaches the resistance level of $9.00, this could further strengthen the market to $9.20, $9.40, and $9.60 resistance levels.
On the downside, a lower possible swing may likely retest the previous support below the 9-day and 21-day moving averages. However, if the bears manage to fuel the market, traders may expect a further drop to the support levels of $6.80, $6.60, and $6.40 respectively. On the other hand, the technical indicator Relative Strength Index (14) is now moving toward the 70-level, indicating that the market may retain the bullish trend.
Against Bitcoin, the Chainlink price remains above the moving averages in other to reach the resistance level of 3500 SAT. Meanwhile, this resistance level is expected to effectively exceed so that the market price may end up closing above it.
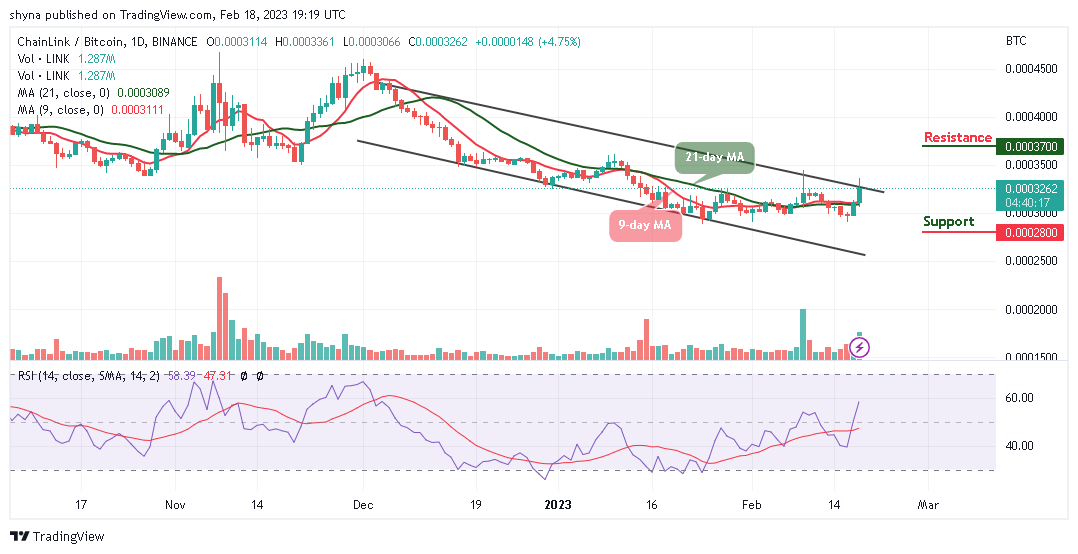
On the other hand, if LINK/BTC slides below the 9-day and 21-day moving averages, it could refresh lows under 3000 SAT and a possible bearish continuation may likely meet the major support at 2800 SAT and below but if the coin crosses above the upper boundary of the channel, it could hit the potential resistance at 3700 SAT and above. However, the technical indicator Relative Strength Index (14) is moving to cross above the 60-level to give more bullish signals.
Chainlink Alternatives
The Chainlink price may continue to move upwards if the price stays above the 9-day and 21-day moving averages. Meanwhile, LINK/USD may reach the resistance level of $9.0 if the bulls focus on the upward trend. On that note, the FGHT crypto project occupies a unique place within the market due to its innovative use cases and lofty goals. Meanwhile, with almost $4.5 million raised, the price of the Fight Out tokens increases every 12 hours, which means it’s important for investors to move quickly and secure the best price.
Join Our Telegram channel to stay up to date on breaking news coverage