Join Our Telegram channel to stay up to date on breaking news coverage
The ApeCoin price prediction shows that APE may head toward the upper boundary of the channel if the price rises further.
ApeCoin Prediction Statistics Data:
- ApeCoin price now – $1.15
- ApeCoin market cap – $424.4 million
- ApeCoin circulating supply – 368.5 million
- ApeCoin total supply – 1 billion
- ApeCoin Coinmarketcap ranking – #72
APE/USD Market
Key Levels:
Resistance levels: 1.60, $1.65, $1.70
Support levels: $0.70, $0.65, $0.60
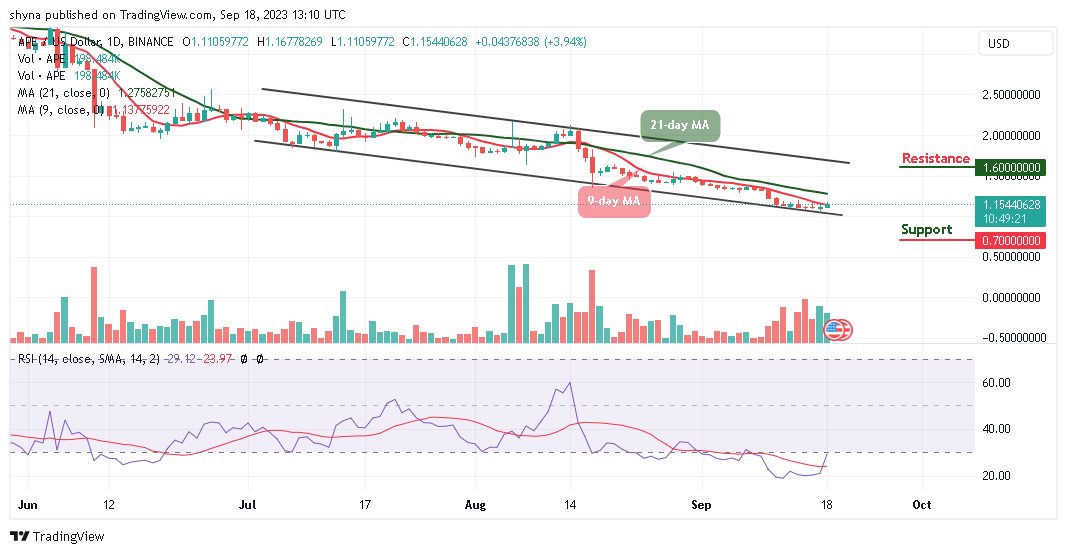
APE/USD is currently trading around the $1.15 level so that it may cross above the 9-day and 21-day moving averages. Meanwhile, in the range of the descending channel, the closest resistance could be located at $1.20, with a close resistance at $1.30. However, if the market increases, additional resistance can be found near the upper boundary of the channel.
ApeCoin Price Prediction: ApeCoin (APE) May Go Bullish
According to the daily chart, it is obvious that the ApeCoin price may likely create more bullish trends once the bearish movement fades away, and this is noticeable for the technical indicator Relative Strength Index (14) as the signal line recovers from the lower boundary of the channel.
At the time of writing, the ApeCoin market keeps rebounding from the daily low of $1.11. However, any bearish movement below the daily low could lead the coin to a serious downtrend toward the lower boundary of the channel. Therefore, the support levels for the coin may be located at $0.70, $0.65, and $0.60, while the resistance levels lie at $1.60, $1.65, and $1.70 respectively.
APE/BTC Begins the Upward Movement
Against Bitcoin, the ApeCoin price may likely cross above the 9-day moving average as the resistance level is built around 4500 SAT. The nearest resistance level is set at 5000 SAT because the market price is still hovering below the 9-day and 21-day moving averages. Meanwhile, the coin may continue to follow the bullish movement if the technical indicator Relative Strength Index (14) recovers above the 30-level.
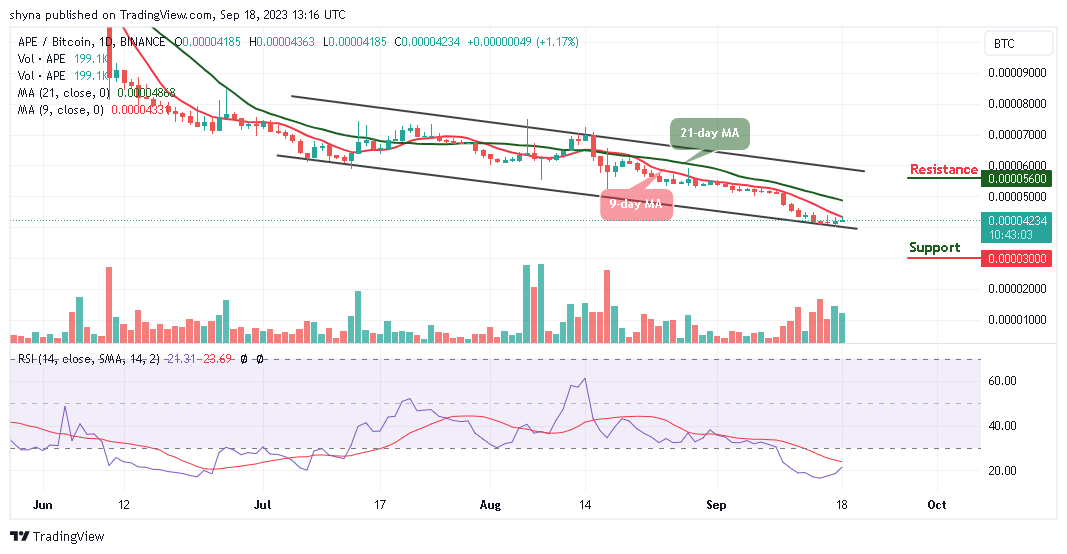
However, if the ApeCoin price crosses below the lower boundary of the channel, APE/BTC may likely hit the support level at 3000 SAT and below. Moreover, if the market price heads toward the upper boundary of the channel, it could reach the potential resistance at 5600 SAT and above.
Alternatives to ApeCoin
The ApeCoin price is seen refreshing to a new high after touching the daily low of $1.11 to touch the resistance level of $1.16. However, the market price may cross above the 9-day and 21-day moving averages but higher support is expected at the $1.10 level.
Meanwhile, the presale for Wall Street Memes ($WSM) has exceeded $25 million in presale, ushering in the concluding stage before the coin’s official exchange launch. However, it’s noteworthy that the token has already raised over $25 million in capital in preparation for its official launch. Therefore, interested buyers are expected to invest now before the launching day.
WALL STREET MEMES PRESALE CURRENTLY HOT. The presale will soon be over… So it is now or never!
CoinCodex - Our Recommended Crypto Research Platform

- Live Cryptocurrency Prices for Over 20,000 Coins
- Crypto Price Analysis with Popular Technical Indicators
- Crypto Price Predictions with Short and Long-Term Charts
- Historical Crypto Market Data Dating to 2010
- Crypto Portfolio, Profit Calculator, and Other Investment Tools
Join Our Telegram channel to stay up to date on breaking news coverage