Join Our Telegram channel to stay up to date on breaking news coverage
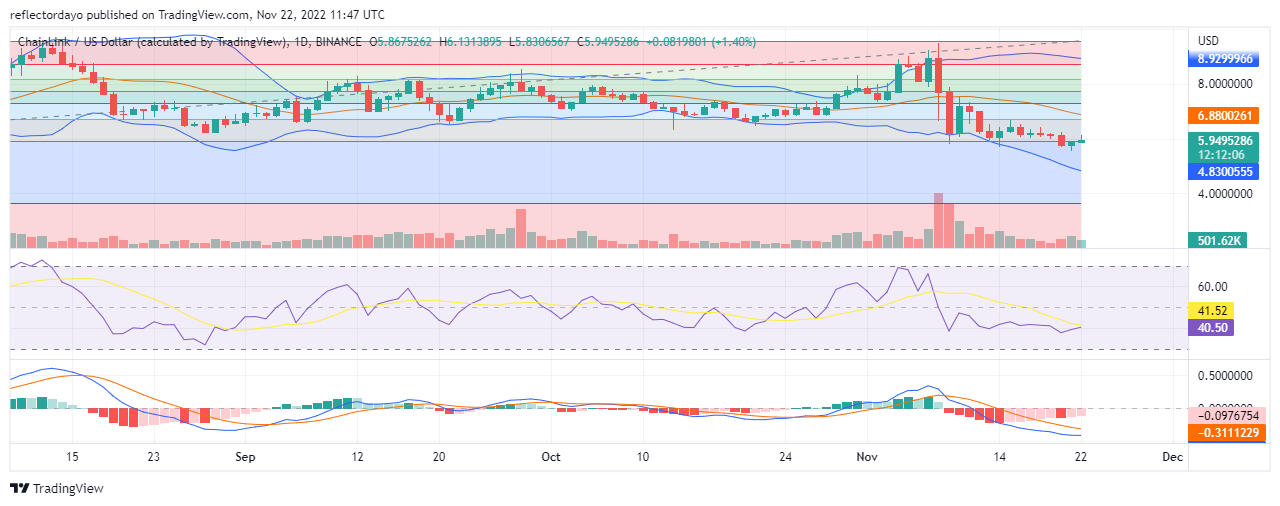
The Chainlink market was in an uptrend before it hits the $8.95 resistance level. From that point, the market saw an explosive two-day bearish move that brought the market slightly below the October 21 support level. The new support was at $6.17. However, as the selling pressure increases, the support level fails to hold. But, in today’s trading session, we see the bulls trying to get above the $6.00 resistance level which was previously the support level for the market.
Chainlink Market Price Statistic:
- LINK/USD price now: $5.94
- LINK/USD market cap: $3,109,800,565
- LINK/USD circulating supply:491,599,970.45
- LINK/USD total supply: 1,000,000,000
- LINK/USD coin market ranking: #21
Key Levels
- Resistance: $6.00, $6.50, $7.00
- Support: $5.00, $4.50, $4.00
Chainlink Market Price Analysis: The Indicators’ Point of View
Bulls fail to maintain the support price and as a result, the support price shifts slightly to a lower level. The upper band of the Bollinger indicator which was previously moving upward is now changing direction to the downside. This is because the sellers are having the upper hand. According to the RSI indicator, the momentum of the market is measured at 41 which is still in the bearish zone as the bullish price recovery seems very sluggish.
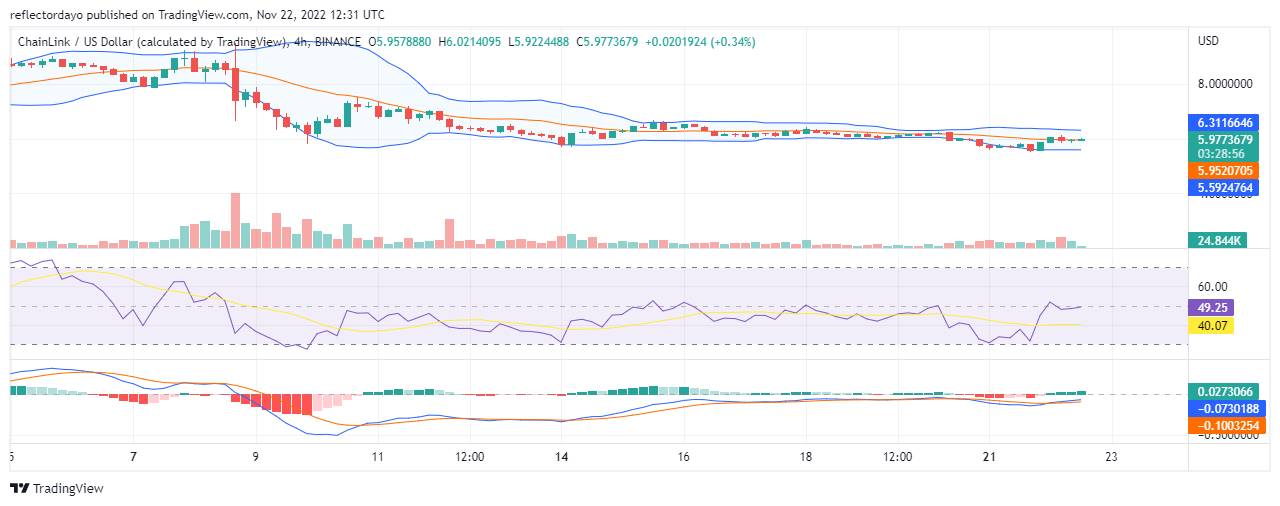
LINK/USD 4-Hour Chart Outlook
From this outlook, we can see that the bands of the Bollinger indicator have become narrow. This is the result of the low volume of trade coupled with an intense struggle between demand and supply. Currently, the RSI line is now ranging at the midpoint of the indicator. And the price action catches up with the 20-day moving average but refuses to cross above the Moving Average line. The ranging market may continue. However, with an increase in the volume of trade, the market can go the bullish way and even attain the $7.000 price level.
The Dash 2 Trade token is not likely to experience much downtrend and periods of indecision as the Chainlink is currently experiencing. It promises a huge return on investment. A novel platform like Dash 2 Trade would have given warning signals in such a case as the FTX disaster. This is an innovative bundle of tools: analytics, metrics, signals, auto-trading, and analysis tools. Right now, the D2T presale is on and it has raised close to $7 million.
Related
Join Our Telegram channel to stay up to date on breaking news coverage