
Join Our Telegram channel to stay up to date on breaking news coverage
The Chainlink price prediction shows that LINK is hovering at $7.53 as the Relative Strength Index (14) moves to cross above the 60-level.
Chainlink Prediction Statistics Data:
- Chainlink price now – $7.53
- Chainlink market cap – $3.8 billion
- Chainlink circulating supply – 517 million
- Chainlink total supply – 1 billion
- Chainlink Coinmarketcap ranking – #20
LINK/USD Market
Key Levels:
Resistance levels: $9.0, $9.2, $9.4
Support levels: $6.2, $6.0, $5.8
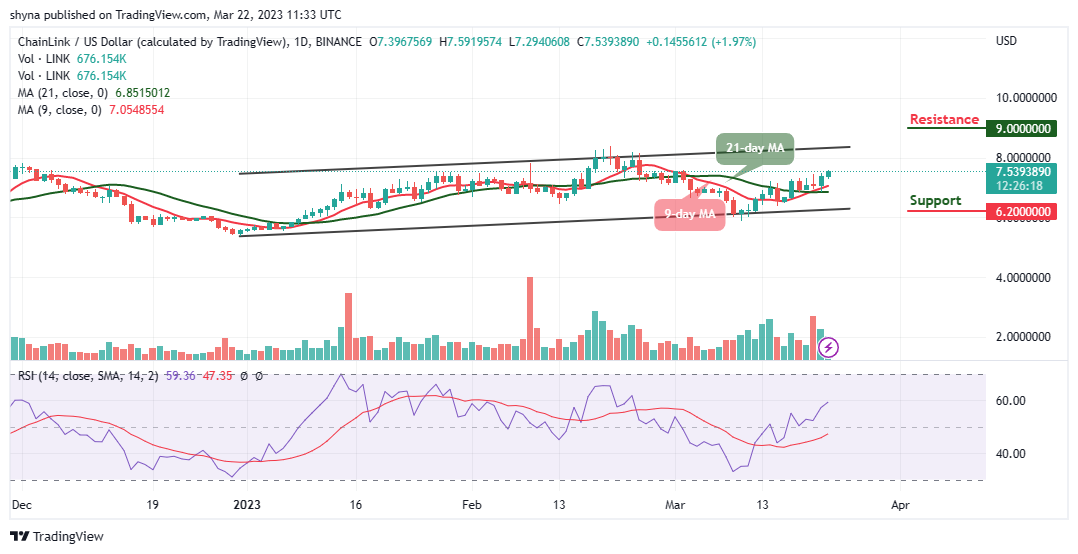
LINK/USD is trading around $7.53, and once it manages to surpass the potential resistance of $7.5, the next target is located at $8.0 where it could trade near the upper boundary of the channel. However, a push from here could send the price straight to around $8.5, but if the current level fails to hold strong, the Chainlink (LINK) could slip below the support level of $7.0.
Chainlink Price Prediction: Is Chainlink Ready for the Upside?
Looking at the daily chart, the Chainlink price bulls are dominating the market, if the buyers put more effort and push the Chainlink price above the channel, LINK/USD may likely hit the resistance levels of $9.0, $9.2, and $9.4 respectively. In addition, any bullish movement above these key resistance levels may likely encourage further buying.
Moreover, any bearish movement towards the lower boundary of the channel may decline towards the critical supports at $6.2, $6.0, and $5.8. Meanwhile, looking at the technical indicator Relative Strength Index (14), Chainlink may exhibit the tendencies to follow an upward trend as the coin moves to cross above the 60-level.
Against Bitcoin, the Chainlink price is attempting to cross above the 9-day moving average which could hit the nearest resistance at 2700 SAT. Therefore, unless this resistance effectively holds and the price ends up closing above it, there might not be any reason to expect a long-term bullish reversal.
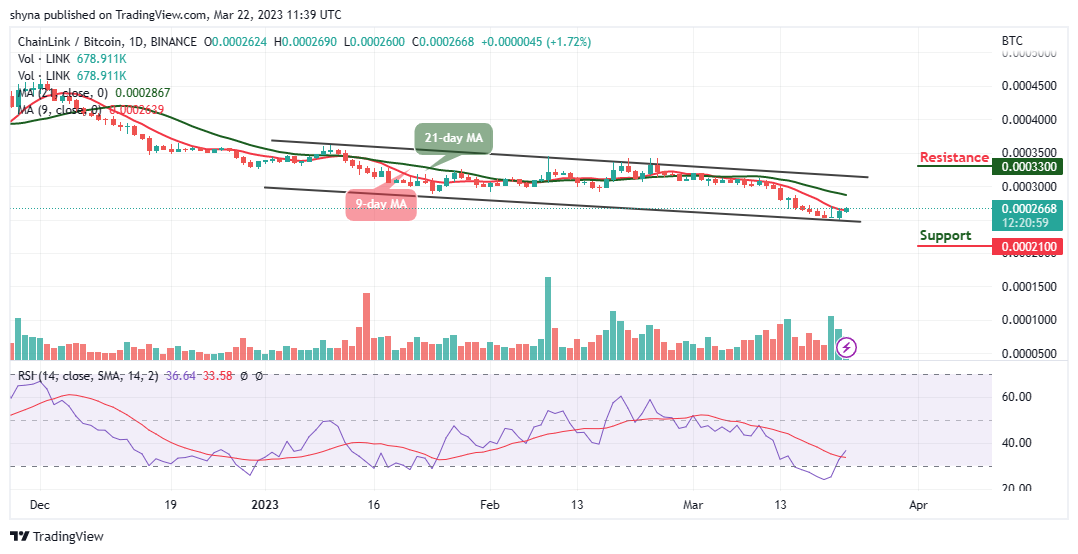
However, any bearish movement below the lower boundary of the channel could refresh lows under 2200 SAT as a possible bearish continuation may likely meet the major support at 2100 SAT and below. Meanwhile, the buyers may push the coin to the potential resistance at 3300 SAT and above. Moreover, the technical indicator Relative Strength Index (14) is ready to cross above the 40-level, suggesting that more bullish signals could play out.
Alternatives to Chainlink
The Chainlink price is changing hands at $7.53, having gained almost 2% since the beginning of the European session. However, with latest the recovery, the coin is likely to head toward the upper boundary of the channel to increase the bullish movement. On the contrary, Love Hate Inu members can earn rewards by voting on polls through the user interface. Meanwhile, with almost $2 million raised in the presale, investors can use LHINU meme coins to cast their votes on topics such as politics, entertainment, sports, and social issues.
Join Our Telegram channel to stay up to date on breaking news coverage