Join Our Telegram channel to stay up to date on breaking news coverage
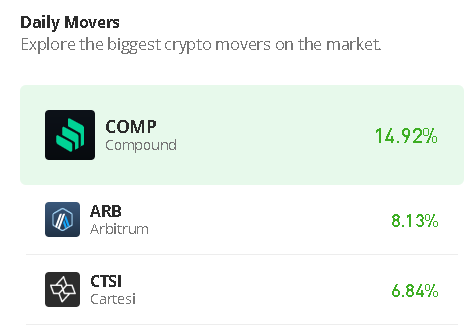
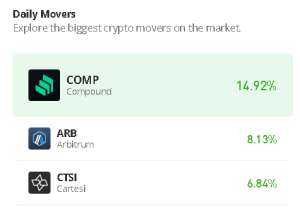
The Cartesi price prediction shows that CTSI could renew the bullish trend after testing the support level of $0.14 today.
Cartesi Prediction Statistics Data:
- Cartesi price now – $0.15
- Cartesi market cap – $112 million
- Cartesi circulating supply – 739.4 million
- Cartesi total supply – 1 billion
- Cartesi Coinmarketcap ranking – #184
CTSI/USD Market
Key Levels:
Resistance levels: $0.25, $0.27, $0.29
Support levels: $0.05, $0.03, $0.01
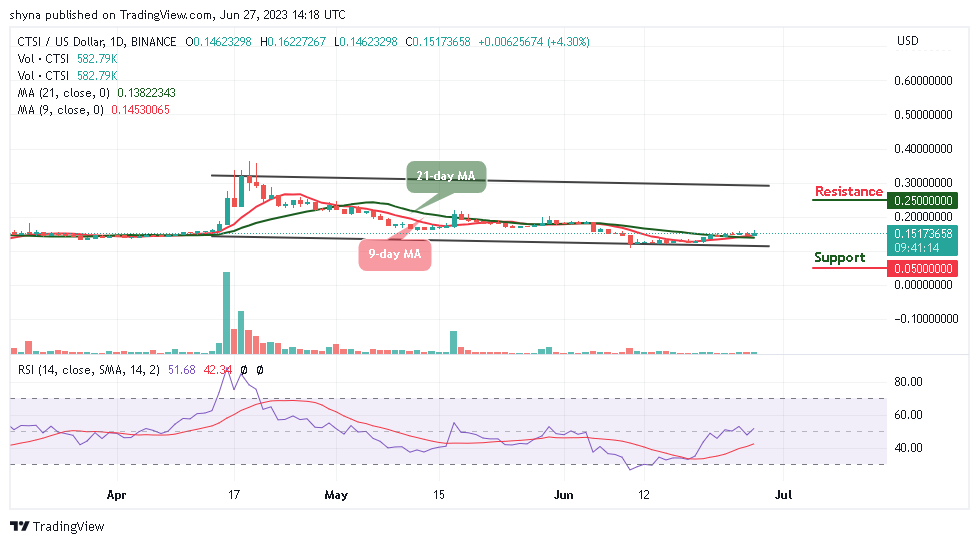
CTSI/USD continues to hover around $0.15 after touching the daily high of $0.16. The Cartesi price is currently changing hands above the 9-day and 21-day moving averages but, with a gain of 4.30% since the start of the day. Despite the recovery, the coin is still hovering below the daily of $0.20.
Cartesi Price Prediction: Would Cartesi Price Spike to the North?
At the time of writing, the Cartesi price is likely to spike toward the resistance level of $0.20 as the initial move toward the upper boundary of the channel could boost the price further up. The Cartesi (CTSI) hits the daily high at $0.16 before retreating to where it is currently trading. Looking at it from above, more bullish movements may come into play if the Cartesi price moves near the upper boundary of the channel, and the nearest resistance level could be found at $0.18.
However, traders can see that the daily movement remains in the hands of the bulls and the technical indicator Relative Strength Index (14) crosses above the 50-level. Moreover, any further bullish movement could push the coin toward the potential resistance levels of $0.25, $0.27, and $0.29, while a drop below the lower boundary of the channel may lead to the supports of $0.05, $0.03, and $0.01 respectively.
Against Bitcoin, the Cartesi is seen moving bearishly which is likely to cross below the 9-day and 21-day moving averages. Meanwhile, after the coin touches the daily high at 534 SAT today, the coin later retreated to where it is currently trading. However, the price could head to the north should buyers put more pressure on the market.
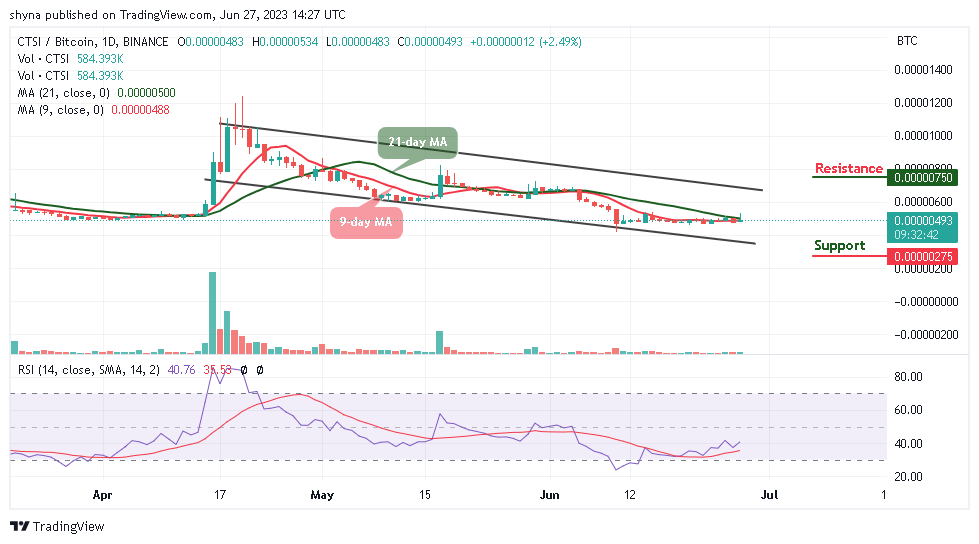
Nevertheless, should the sellers return to the market, the Cartesi price may drop to the support of 275 SAT and below. Now, the technical indicator Relative Strength Index (14) moves to cross above the 40-level and the market could face an upward movement in the next positive direction so that the resistance level could be located at $750 and above.
Alternatives to Cartesi
Looking at the daily chart, the Cartesi price could face the north as it is hovering above the 9-day and 21-day moving averages. However, today’s low at $0.14 could serve as strong support for the coin, but if it is broken, the sell-off may be extended to $0.10.
Nevertheless, the main differentiator between the Wall Street Memes Token and other meme coins is its mission: to disrupt the traditional financial landscape by empowering everyday investors. So far, the token has raised almost $10 million in the ongoing presale.
Read more:
- Ethereum Price Prediction: ETH/USD Stuck in Range While the Price Fails to Cross $195
- Litecoin Price Prediction: LTC/USD Bulls Are Not Ready to Regain Initiative; Price Hovers at $57
- Radicle Price Prediction as RAD Threatens Bullish Break Above This Key Level
New OKX Listing - Wall Street Memes

- Established Community of Stocks & Crypto Traders
- Featured on Cointelegraph, CoinMarketCap, Yahoo Finance
- Rated Best Crypto to Buy Now In Meme Coin Sector
- Team Behind OpenSea NFT Collection - Wall St Bulls
- Tweets Replied to by Elon Musk
Join Our Telegram channel to stay up to date on breaking news coverage