Join Our Telegram channel to stay up to date on breaking news coverage
The Cartesi price prediction reveals that CTSI has been following the bullish movement over the past few days as the coin spikes to the north.
Cartesi Prediction Statistics Data:
- Cartesi price now – $0.20
- Cartesi market cap – $149.8 million
- Cartesi circulating supply – 767.6 million
- Cartesi total supply – 1 billion
- Cartesi Coinmarketcap ranking – #278
CTSI/USD Market
Key Levels:
Resistance levels: $0.23, $0.24, $0.25
Support levels: $0.16, $0.15, $0.14

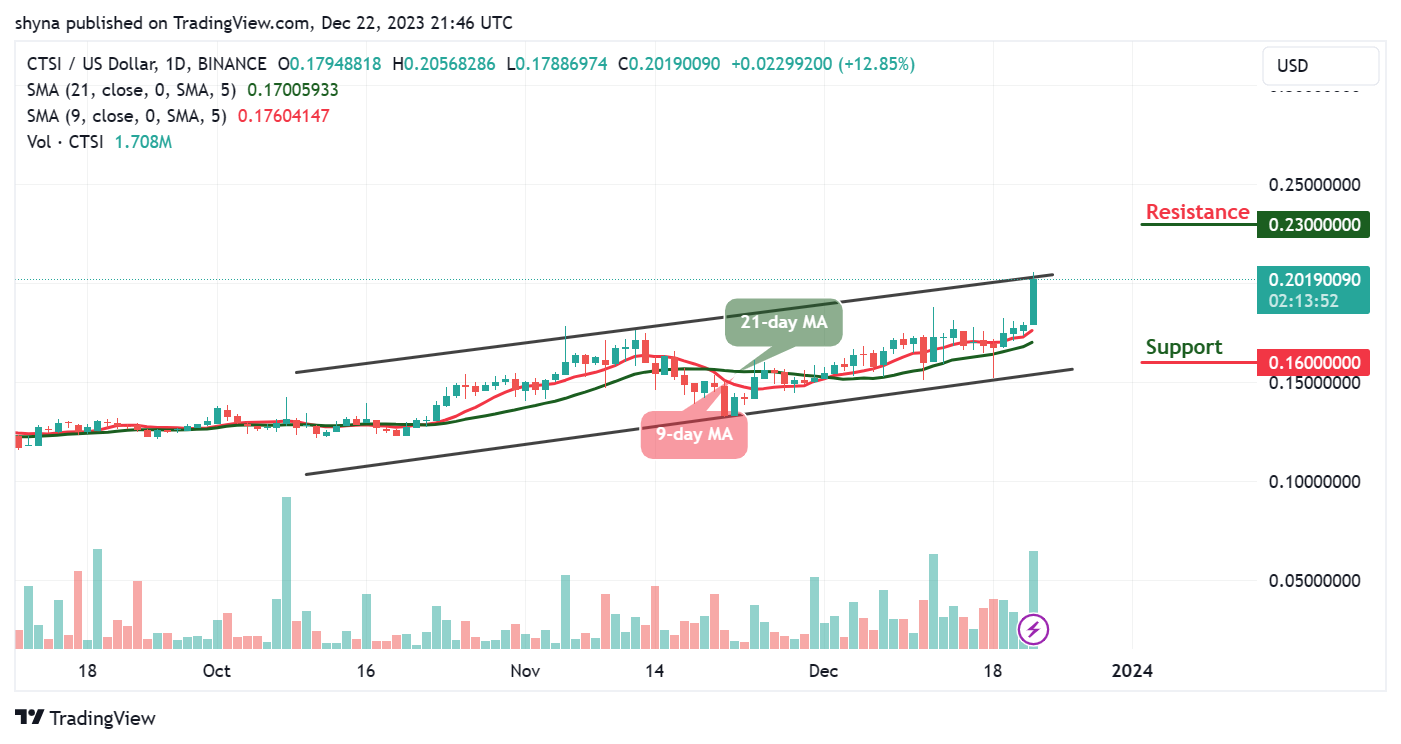
CTSI/USD is moving up with a slight increase of around 12.85% during the European session today; it is currently trading at $0.20 far above the 9-day and 21-day moving averages. For the past few weeks, the Cartesi price has been hovering above the moving averages. With this, CTSI/USD is still making an effect to cross above the upper boundary of the channel.
Cartesi Price Prediction: Where Could CTSI Price Go Next?
Since the past few days, the Cartesi price has remained relatively strong as bulls increase the pressure. The movement to a downward trend has been cut short according to the daily chart. However, the Cartesi price touches the low of $0.17 but still maintains the bullish movement.
Moreover, a significant cross above the upper boundary of the channel could sustain the bulls to a $0.22 high. Meanwhile, if CTSI manages to surge above this level, it may see the resistance levels at $0.23, $0.24, and $0.25, while a bearish drop may bring the price to the support levels of $0.16, $0.15, and $0.14 respectively.
CTSI/BTC Consolidates Above the Moving Average
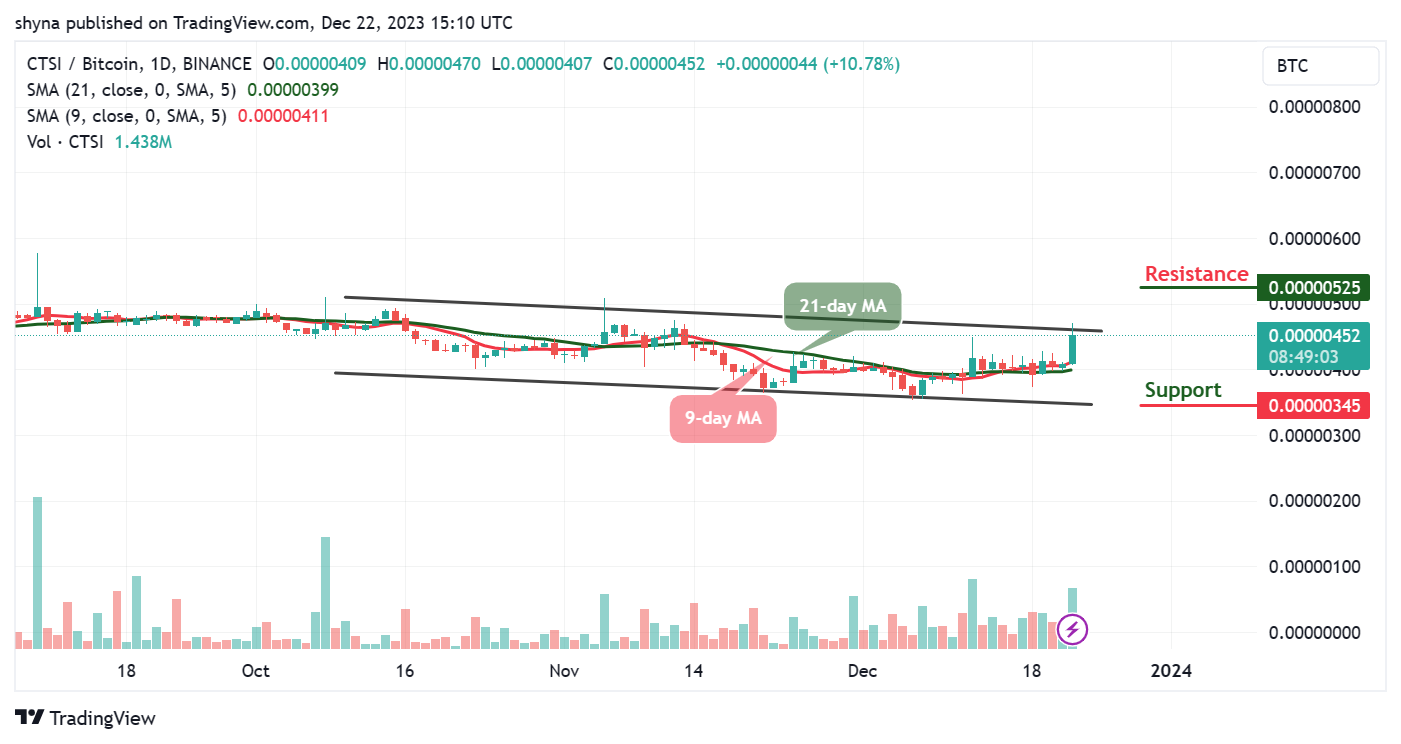
Against Bitcoin, before this time, the Cartesi price has been moving bearishly and trading within the 9-day and 21-day moving averages. For now, CTSI/BTC is trading at 452 SAT and expecting a break above the upper boundary of the channel. Meanwhile, looking at the daily chart, the bulls are now dominating the market, to push the market price toward the north.

Nevertheless, if the market drops and heads toward the lower boundary of the channel, the next key support may come at 345 SAT and below. On the bullish side, a possible rise could push the market above the upper boundary of the channel to hit the resistance level of 525 SAT and above.
Alternatives to Cartesi
According to the daily chart, the Cartesi price spikes above $0.18, positioning itself for potential bullish signals as the coin moves to cross above the upper boundary of the channel which could boost the price further up. However, there’s a possibility that Cartesi (CTSI) could hit the resistance level of $0.22 if the bullish momentum intensifies.
Nevertheless, Investors are advised to consider both Cartesi (CTSI), with a market cap of $149.8 million, and Bitcoin Minetrix, a promising low-cap token that raised over $5.8 million in its initial coin offering. While CTSI offers stability due to its established market position, Bitcoin Minetrix presents the potential for significant gains as a low-cap option.
Join Our Telegram channel to stay up to date on breaking news coverage


