Join Our Telegram channel to stay up to date on breaking news coverage
The Cartesi price prediction is getting ready to cross above the upper boundary of the channel after a rapid retracement.
Cartesi Prediction Statistics Data:
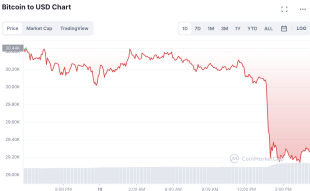
- Cartesi price now – $0.32
- Cartesi market cap – $2.7 million
- Cartesi circulating supply – 6.9 million
- Cartesi total supply – 1 billion
- Cartesi Coinmarketcap ranking – #159
CTSI/USD Market
Key Levels:
Resistance levels: $0.40, $0.45, $0.50
Support levels: $0.15, $0.10, $0.05
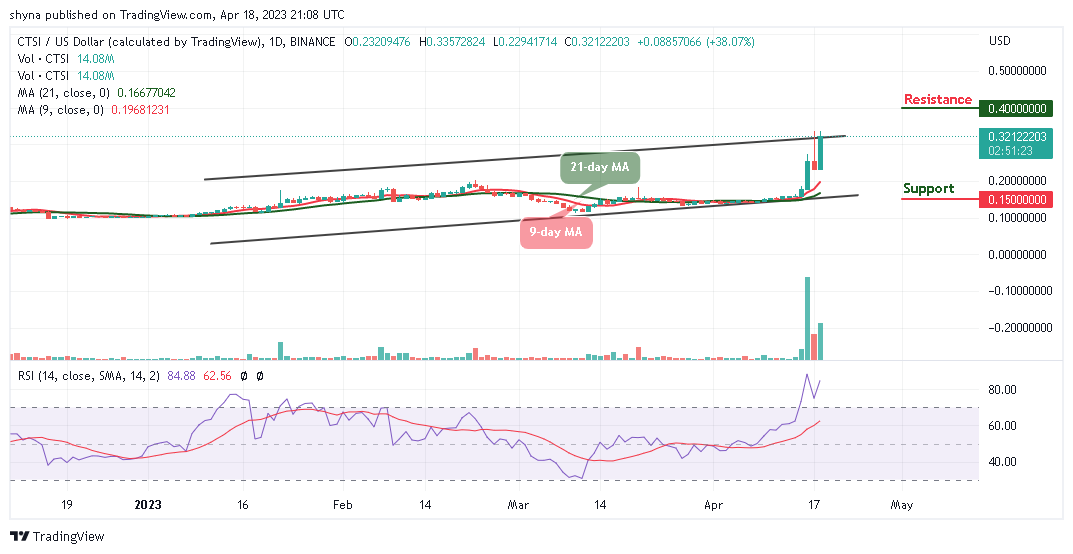
CTSI/USD is currently recovering above the opening price of $0.23 and it is likely to climb above $0.35 soon. Meanwhile, the Cartesi price is now trading above the 9-day and 21-day moving averages as bulls begin to dominate the market.
Cartesi Price Prediction: CTSI Could Reach $0.35 Level
The Cartesi price may cross above the upper boundary of the channel. However, if CTSI/USD breaks above the channel, it could visit an important resistance at $0.35. Therefore, a successful break above this level could open another increase above the $0.38 level and the price is likely to rise toward the $0.40, $0.045, and $0.50 resistance levels in the next positive direction.
As the technical indicator, Relative Strength Index (14) crosses above the 60-level, the market may soon break to the upside but crossing below the 9-day and 21-day moving averages could touch the $0.30 support. The next major support is toward the lower boundary of the channel, where the bulls are likely to take a strong stand but any further losses could lead the price to $0.15, $0.10, and $0.05 support levels.
When compares with Bitcoin, the Cartesi price is now moving above the 9-day and 21-day moving averages as the market keeps moving around the upper boundary of the channel. Meanwhile, the technical indicator Relative Strength Index (14) stays within the overbought region confirming the bullish movement.
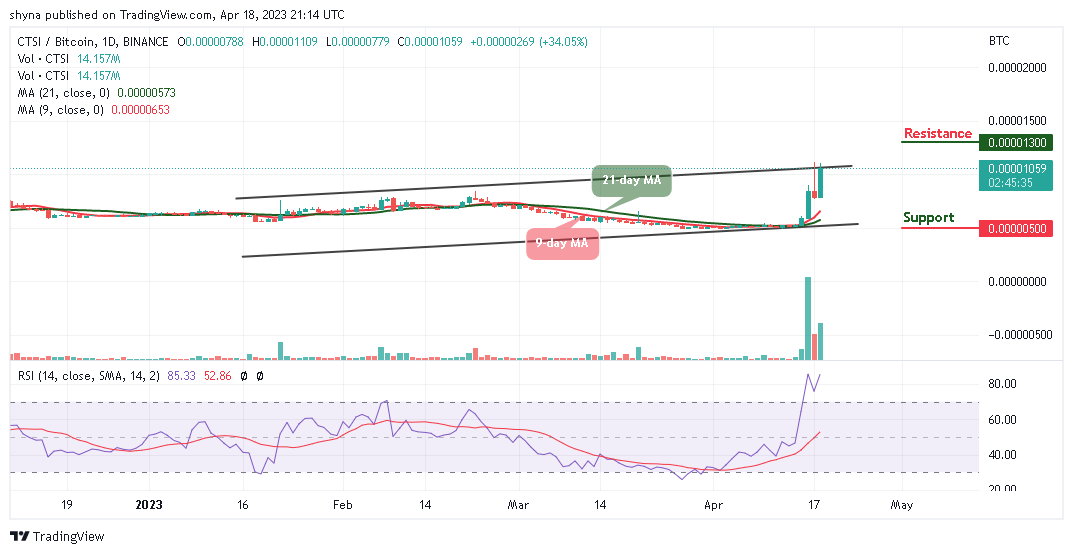
However, if the price breaks above the upper boundary of the channel, bulls might push the market back to the resistance level of 1200 SAT. Moreover, if the price stays above this level, it could hit the resistance level of 1300 SAT and above. On the other hand, crossing below the 9-day and 21-day moving averages may locate the support level at 500 SAT and below.
Cartesi Alternatives
The Cartesi (CTSI) looks green today as the price touches the resistance level of $0.33 and a daily close above this level may increase the market price to $0.40. However, traders should note that a consistent price increase may bring more buyers into the market as bulls increase their positions. Meanwhile, in its early days of the presale, Love Hate Inu has raised more than $5 million already and is burning through the presale stages. With a price increase coming at each new stage, it’s imperative that you buy now if you want to take advantage of the best price.
Join Our Telegram channel to stay up to date on breaking news coverage