
Join Our Telegram channel to stay up to date on breaking news coverage
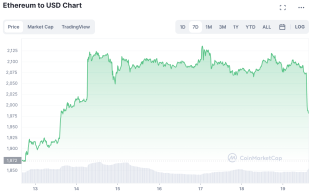
BTC has had an impressive rally of 80% this year, surpassing traditional assets such as the Nasdaq index. This upward trend comes after a 12-month downturn in which BTC prices dropped 76%, reaching their lowest point in November 2022.
Vetle Lunde Predicts Bitcoin To Reach $45,000 in Coming Weeks
Vetle Lunde, a senior analyst at K33 Research, thinks that the present pattern closely resembles the one observed during the bear market of 2018-19.
Lune has made a comment saying “Bottoms in both cycles lasted for approximately 370 days. And the peak-to-trough return after 510 days of both cycles reached 60%,” Lunde said in a note sent to clients last week. “In 2018, the bear market rally topped 556 days after the 2017 peak, on June 29, 2019, with a 34% drawdown from the peak.”
Lunde emphasizes that the history of the previous bear market cycle is unlikely to repeat in a similar fashion, but the similarities in the pattern are intriguing. Bitcoin fell 84% in 2018, with prices bottoming near $3,100 in December. However, the trend changed in the following months, with prices climbing to $3,700 by the start of 2019 and rising as high as $13,800 by the end of June.
Crypto observers on Twitter have referred to BTC’s rise so far this year as a “hated bullish move”. This is because some well-known traders were prepared for a further sell-off in the first quarter.
A bull market that is considered “hated” typically starts during a time of heightened pessimism, and it gains momentum when investors who had reduced their risk due to expectations of a prolonged decline start to feel underexposed and jump on the bullish trend.
According to Lunde, the early 2023 rally has all the hallmarks of a hated rally, and the “hated rally of 2019” ended with a significant blow-off top before BTC resumed trading at a 40-60% drawdown from its 2017 all-time high.
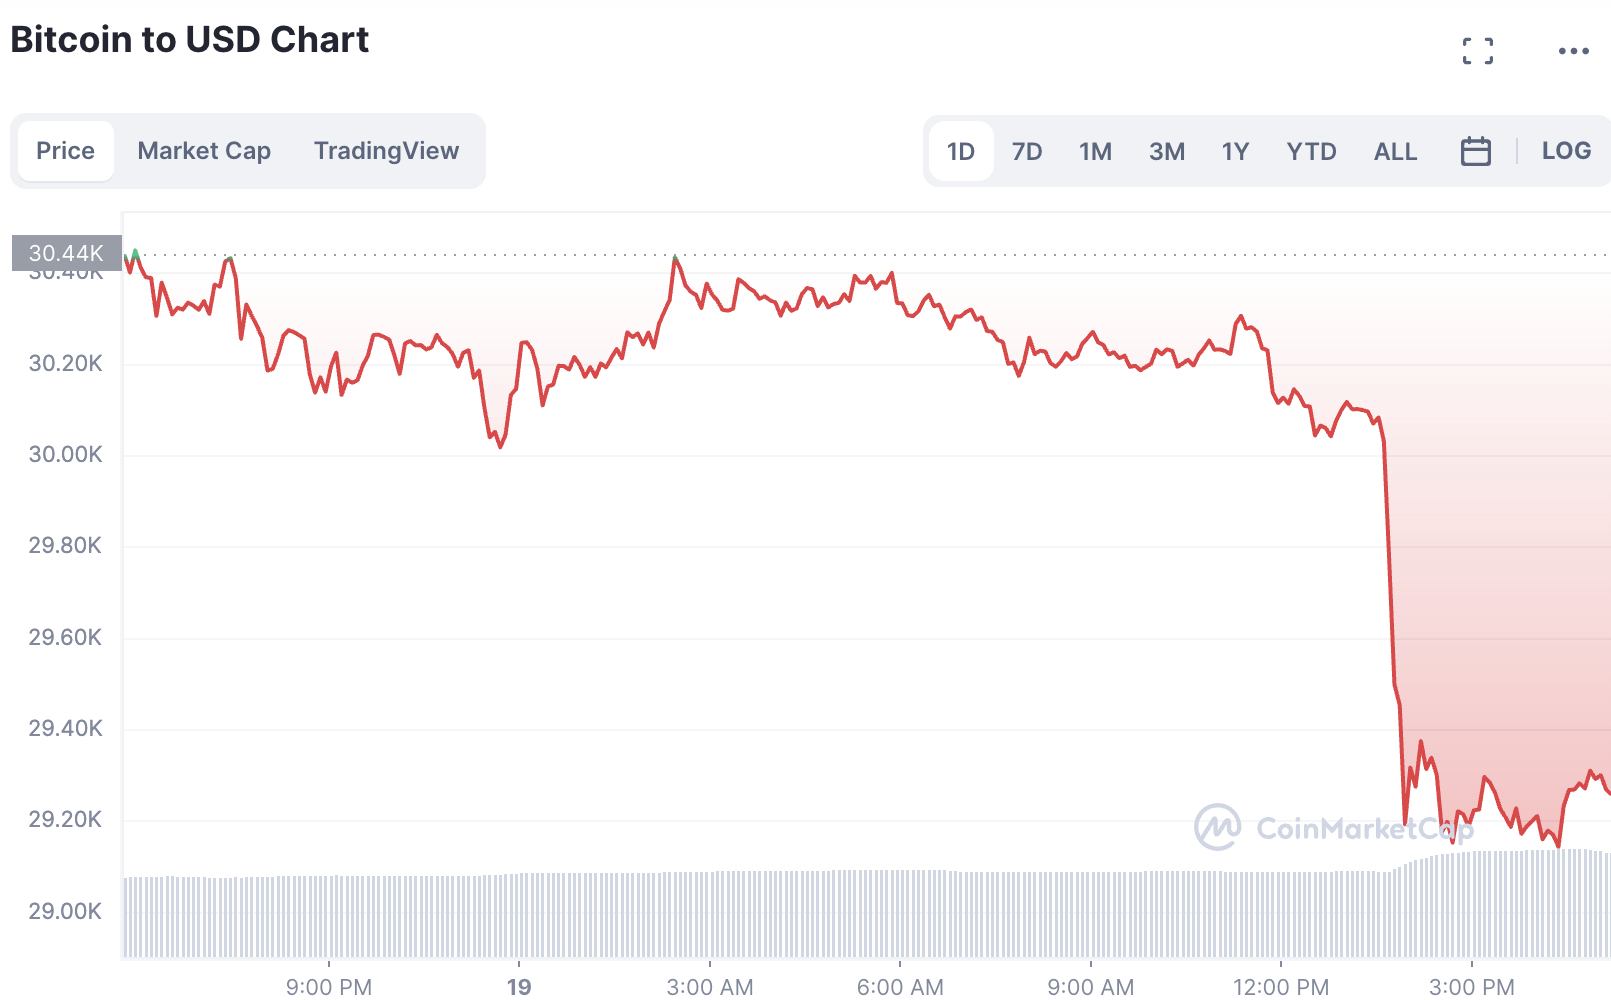
Currently, Bitcoin’s price is at $29,181, representing a 2.5% decline for the day. Although the future is uncertain, Lunde’s analysis suggests that Bitcoin may continue to surge in the coming weeks and could potentially reach a peak of $45,000.
Bitcoin’s Technical Analysis Shows Resemblance of a Historical Pattern
Bitcoin’s technical analysis is always closely watched by the cryptocurrency community, and the recent revelation of an ascending triangle pattern on the daily chart has generated a lot of buzz.
The ascending triangle is a well-known bullish continuation pattern that usually forms during an upward trend, indicating that the buying pressure is increasing, while the selling pressure remains constant. This is an optimistic sign for Bitcoin investors as it may indicate a significant price breakout in the near future.
The pattern was highlighted by Jake Wujastyk, a popular cryptocurrency analyst, on Twitter, and his tweet drew attention to the ascending triangle pattern, further noting that this development could lead to substantial upward movement in Bitcoin’s price.
However, as with any technical analysis, there is no guarantee that the pattern will play out as predicted, and traders must remain vigilant and consider other factors that could impact Bitcoin’s price trajectory.
Bitcoin rebounded from a one-week low on Tuesday, reaching a peak of $29,944.78, as markets reacted to the latest gross domestic product (GDP) report from China. Although Bitcoin’s price is currently sitting at $29,181, down 2.5% over the past 24 hours, the rebound has come as the 14-day relative strength index (RSI) bounced from a floor of 59.00.
The current price strength is tracking at the 61.91 mark, with the next visible ceiling at the 65.00 level, indicating that Bitcoin could be trading above $30,200 if the RSI reaches this upcoming destination.
While the ascending triangle pattern is viewed as a positive sign by investors, it is important to approach any investment decision with caution and proper research.
Bitcoin Drops To $29,181 After Surpassing Tuesday’s Gains
Bitcoin price rebounded above the key $30,000 level on April 19th, after falling below $29,250 the previous day. This sudden gain of $500 in value was welcomed by traders, who had expressed concerns about BTC’s ability to maintain its foothold above $30,000.
BTC registered daily gains of around 4% as a result of increased liquidity during Wall Street’s opening trading sessions, however, the token is now down by about 2.5% for the day.
A popular crypto analyst on Twitter highlighted BTC’s slide towards $29,000, describing it as a cause for concern. However, the analyst noted that the crypto would need to produce another daily close above the 2023 high of $31,035 to regain bullish momentum. Fortunately, this feat was achieved on April 19th, when BTC regained its position above the psychological level of $30,000.
If buying pressure continues, the next logical move would be a climb to the $31,035 local high, which could result in the largest cryptocurrency by market cap returning to the psychological level of $32,000. This would represent a 5.32% uptick from the current price.
The Simple Moving Averages (SMA) are pointing upward, indicating that a new group of buyers is entering the market. The 50-day SMA, 100-day SMA, and 200-day SMA, at $26,668, $24,612, and $21,279 respectively, have provided strong support zones for BTC on the downside.
Additionally, the Relative Strength Index (RSI) is in the positive region, indicating that there is more room for the upside. If BTC continues its uptrend, the RSI could soon generate a buy signal, which could solidify the uptrend for the king crypto in the short term.
However, if buying pressure reduces, BTC’s price could turn down from current levels and slide below the $30,000 mark. This scenario could see BTC drop to find support around $29,100 or lower, potentially revisiting the $28,000 psychological level or the March 15 low below $25,000.
Related Articles
- Is it too late to buy Bitcoin?
- Bitcoin Price Prediction
Join Our Telegram channel to stay up to date on breaking news coverage