Join Our Telegram channel to stay up to date on breaking news coverage
The Cardano price prediction shows that ADA is attempting to break to the upside as the coin hovers above the moving averages.
Cardano Statistics Data:
- Cardano price now – $0.51
- Cardano market cap – $17.4 billion
- Cardano circulating supply – 33.7 million
- Cardano total supply – 34.2 billion
- Cardano Coinmarketcap ranking – #8
ADA/USD Market
Key Levels:
Resistance levels: $0.70, $0.75, $0.80
Support levels: $0.35, $0.30, $0.25
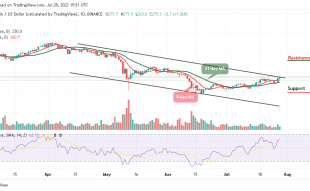
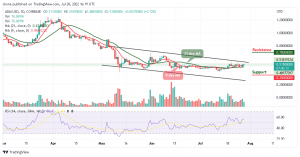
ADA/USD is attempting to cross above the upper boundary of the channel while the $0.50 support level remains the critical support where the price has been holding for some time now. However, for the past few days ago, ADA/USD has been ranging around the 9-day and 21-day moving averages, and this refrains the coin from heading to the upside.
Cardano Price Prediction: Will Cardano Move Higher?
The Cardano price may begin to rise and could probably cross above the upper boundary of the channel if the bulls defend the $0.51 level. Therefore, any further bullish movement towards the channel may push the price to the potential resistance levels of $0.70, $0.75, and $0.80.
Therefore, this technical analysis may be invalidated if the bears break below the moving averages and head towards the lower boundary of the channel which could hit the support levels at $0.35, $0.30, and $0.25. Moreover, the technical indicator Relative Strength Index (14) is moving below the 60-level, suggesting sideways movement.
ADA/BTC Market: Price Heads to the Downside
Against Bitcoin, the Cardano price is sliding below the 9-day and 21-day moving averages. Any further bearish movement towards the downside may create an additional low for the market.
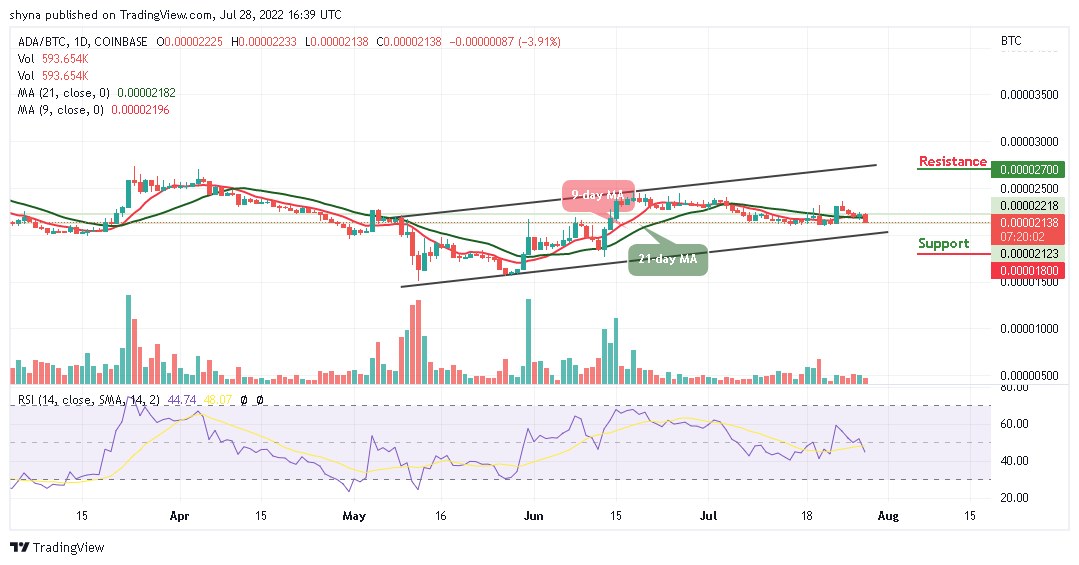
However, if the buyers could reclaim and push the price above the moving averages, higher resistance could be located at 2700 SAT and above. Looking at the daily chart, the technical indicator Relative Strength Index (14) is moving to cross below the 40-level, indicating that sellers are coming to play. Moreover, should the bulls fail to move the current market value to the upside, the bears may increase the selling pressure, and the nearest support level could be located at 1800 SAT and below.
Read more:
Join Our Telegram channel to stay up to date on breaking news coverage