Join Our Telegram channel to stay up to date on breaking news coverage
The Binance Coin price prediction shows that BNB begins to move to the upside as the bears lose grip over the coin.
Binance Coin Prediction Statistics Data:
- Binance Coin price now – $275
- Binance Coin market cap – $44.7 billion
- Binance Coin circulating supply – 161.3 million
- Binance Coin total supply – 161.3 million
- Binance Coin Coinmarketcap ranking – #5
BNB/USD Market
Key Levels:
Resistance levels: $360, $380, $400
Support levels: $200, $180, $160
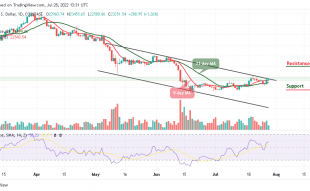
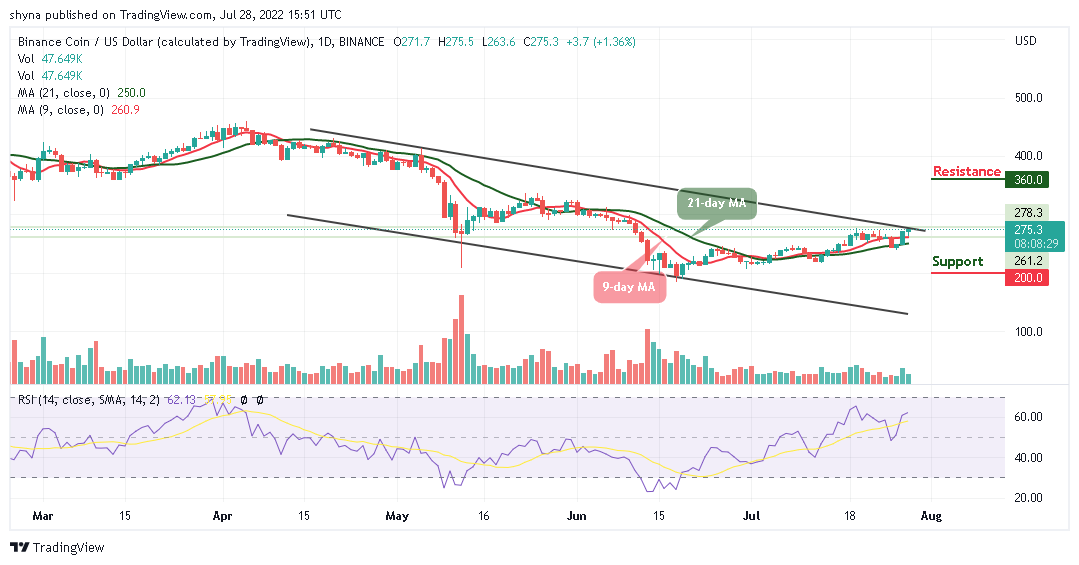
BNB/USD is seen attempting to cross above the upper boundary of the channel as the coin moves to touch the daily high of $275. For the past couple of days, the coin has been trading towards the 9-day and 21-day moving averages heading to the upside.
Binance Coin Price Prediction: Binance Coin (BNB) Begins the Upward Movement
The Binance Coin price is expected to stay above the 9-day and 21-day moving averages for it to gain the upside. Therefore, if the bulls defend the $250 level, the coin may continue its upward movement by crossing above the upper boundary of the channel. However, any further bullish movement could then hit the potential resistance levels of $360, $380, and $400.
Nevertheless, this prediction may not be right if the bears return into the market and break towards the lower boundary of the channel, the Binance Coin could touch the low of $200, $180, and $160 supports. Moreover, the technical indicator Relative Strength Index (14) is staying above the 60-level; suggesting that more bullish movements are likely to play out.
BNB/BTC Market: Price May Consolidate to the Downside
Against Bitcoin, the Binance coin price is trying to move down as it is likely to cross below the 9-day and 21-day moving averages with the next support level at 1110 SAT. On the contrary, any bullish movement may likely push the coin above the upper boundary channel.
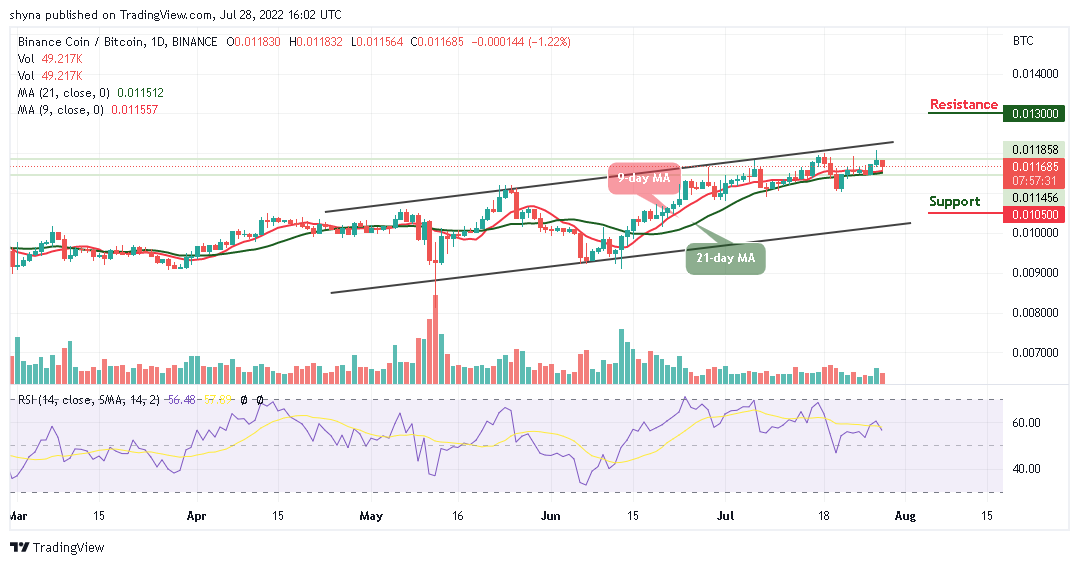
If the buyers could push the price to the upside, higher resistance could be located at 1300 SAT and above. Moreover, should the bulls fail to enter the market, it may head towards the lower boundary of the channel and it could hit the support level of 1050 SAT and below while the technical indicator Relative Strength Index (14) nosedives below 60-level, showing that sellers may soon come to play.
Read more:
- How to buy Binance Coin
Join Our Telegram channel to stay up to date on breaking news coverage