Join Our Telegram channel to stay up to date on breaking news coverage
Bitcoin (BTC) Price Prediction – September 8
Over the past days, Bitcoin (BTC) tried to break above the $10,000 mark but with no success.
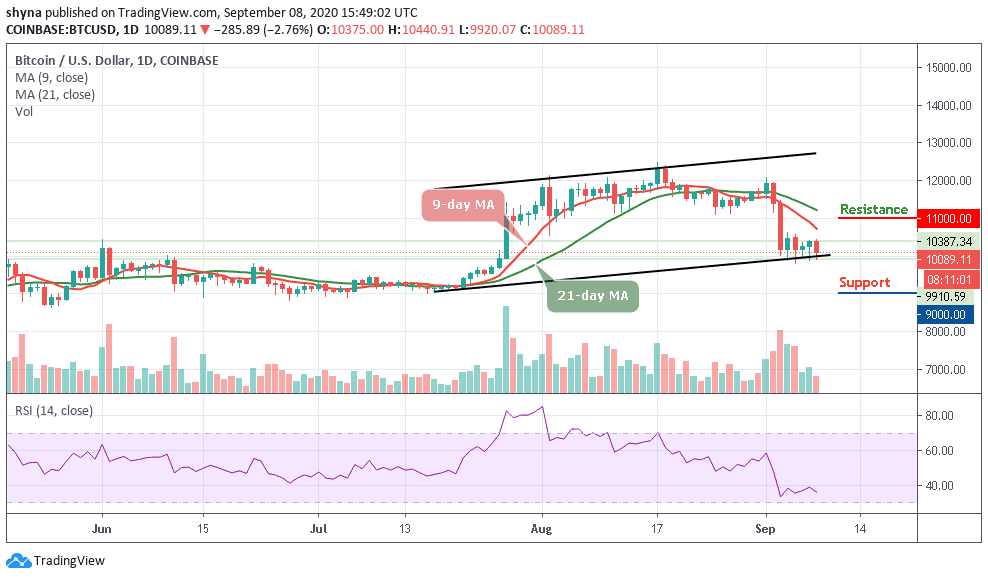
BTC/USD Long-term Trend: Ranging (Daily Chart)
Key levels:
Resistance Levels: $11,000, $11,200, $11,400
Support Levels: $9,100, $8,900, $8,700

Today, BTC/USD is currently losing its balance below the $10,000 support level as traders remained jittery about its recent fall from $10,440. The BTC/USD exchange rate fell to an intraday low of $9,920, down 3.71 percent from its opening rate. The latest sell-off appeared on the backs of a stronger US dollar. The greenback rose 0.32 percent during the early morning London session but couldn’t gain much before sliding back below $10,000.
What to Expect from Bitcoin (BTC)
As long as the technical picture remains intact, Bitcoin bulls will have a fighting chance at reclaiming the support at $10,000. Traders should note that the Bitcoin price is holding below the 9-day and 21-day moving averages. This means that the technical health of Bitcoin is weakening as the bulls are losing the market with a serious downward trend.
However, on the downside, another drop under $9,800 could open with losses likely to increase fast towards $9,500. A lower price for Bitcoin is the only way to create support and bring back buyers into the market. Moreover, the fight to remain above $10,000 will continue to take precedence.
On the upside, a recovery above $10,300 and $10,500 levels could pave the way for another run-up to $11,000, $11,200, and $11,400 respectively. On the flip side, support is expected at $9,100, $8,900, and $8,700. It is apparent that bears have more strength with the RSI (14) printing a bearish session.
BTC/USD Medium – Term Trend: Bearish (4H Chart)
Looking at the 4-hour chart, Bitcoin’s price is currently trading around $10,068 and below the 9-day and 21-day moving averages after falling from $10,440 where the coin touched today. From a technical point of view, the trend is in the hands of the sellers.
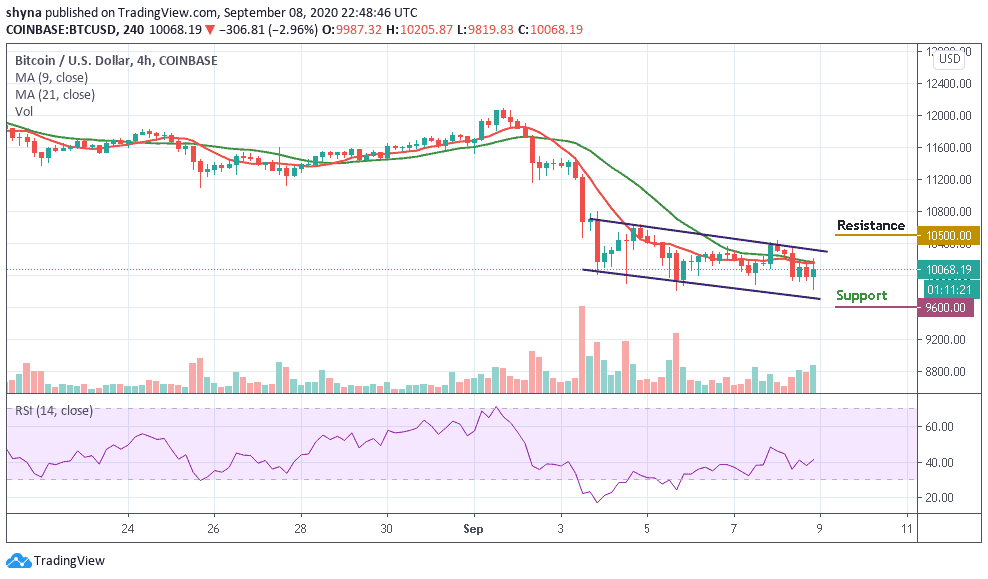
However, the RSI (14) is moving above the 40-level. As long as the downward trend continues, keeping Bitcoin above $10,300 may be a daunting task. In this case, it is best we look at possible support levels, starting at $9,600 and below while the resistance levels lie at $10,500 and above.
Join Our Telegram channel to stay up to date on breaking news coverage