Join Our Telegram channel to stay up to date on breaking news coverage
Bitcoin (BTC) Price Prediction – September 8
The cryptocurrency market has remained gloomy since the massive decline of September 2 and 3.
BTC/USD Long-term Trend: Ranging (Daily Chart)
Key levels:
Resistance Levels: $11,000, $11,200, $11,400
Support Levels: $9,000, $8,800, $8,600
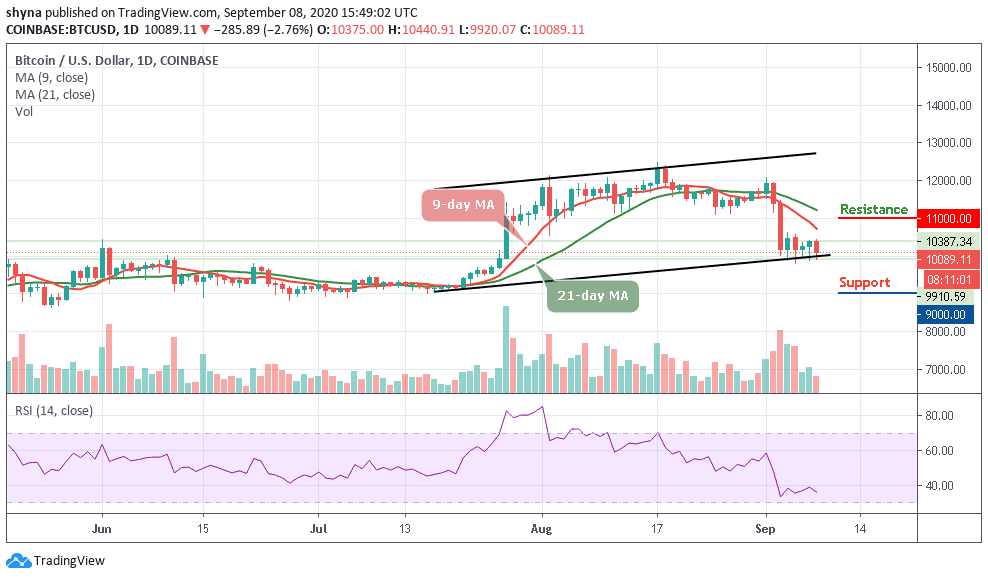
BTC/USD has been struggling to maintain its position above $10,000 as the coin saw another dive below the $10k mark today. The Bitcoin (BTC) is in a dangerous position as the price slipped below the critical support level of $10,000 during the early Asian hours. If the breakthrough is confirmed, the downside momentum will gain traction with the next focus on $9,600. At the time of writing, Bitcoin is trading below the 9-day and 21-day moving averages of at $10,089 with a decline of 2.76% on the daily price chart.
Where is BTC Price Going Next?
Bitcoin plunged below $10,000 one more time, marking $9,920 as the current daily low at the moment. What does it mean? Is Bitcoin finally leaving the significant $10,000 support level and searching for new lows? However, looking at the declining daily volume candles, together with the steady but stable recent Bitcoin price action, we can assume that a stronger negative move may be coming soon. At the moment, the RSI (14) is seen moving below 35-level, which may likely enter into the oversold region.
Looking at the daily chart, BTC/USD is struggling to maintain the $10,000 support level. If the coin fails to remain above this level, then, it could drop to the next support levels of $9,000, $8,800, and $8,600. From above, maintaining the $10,000 level could send the coin to retest old support turned resistance levels at $10,500. The further movement could go above the significant 9-day and 21-day moving averages, which could send the price towards the resistance levels of $11,000, $11,200, and $11,400.
BTC/USD Medium – Term Trend: Bearish (4H Chart)
Looking at the 4-hour chart, the bears have been dominating the market tremendously while the bulls are trying to defend the $10,000 support. Meanwhile, the $9,500 and below may come into play if BTC breaks below the mentioned support.
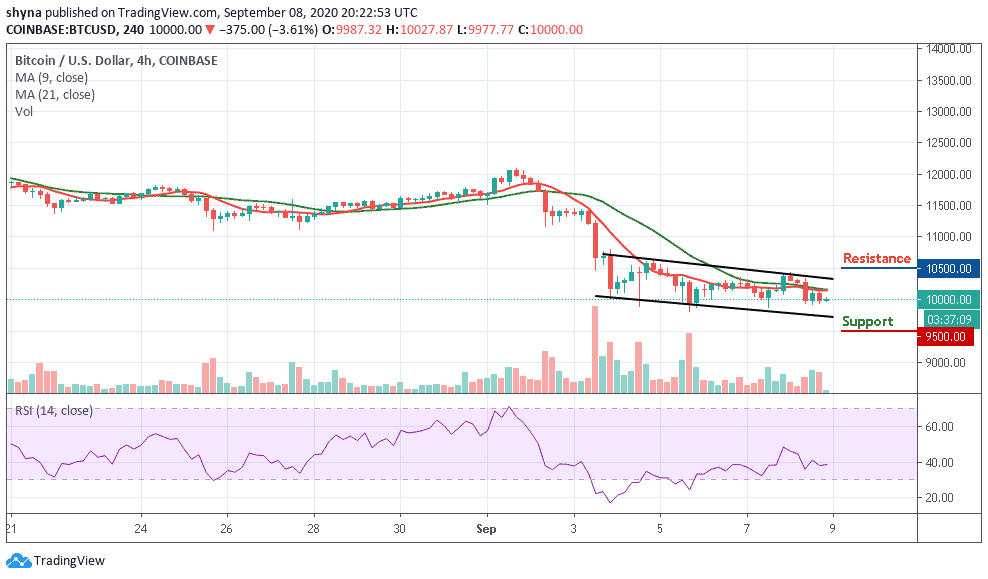
However, if the buyers can push the market price above the 9-day and 21-day moving averages, traders may expect a retest at the $10,300 resistance level, and breaking this level may further allow the bulls to reach $10,200 and above. The RSI (14) is at the 46-level, suggesting a bullish movement.
Join Our Telegram channel to stay up to date on breaking news coverage