Join Our Telegram channel to stay up to date on breaking news coverage
Bitcoin (BTC) Price Prediction – December 29
Bitcoin struggles to gain momentum following $27,073 rejection as the crypto has been trading between the $26,000 and $27,000 region.
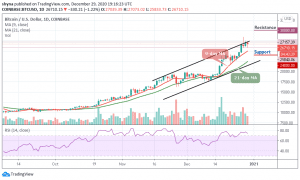
BTC/USD Long-term Trend: Bullish (Daily Chart)
Key levels:
Resistance Levels: $30,000, $30,200, $30,400
Support Levels: $24,000, $23,800, $23,600

At the time of writing, BTC/USD is trading down with 0.33% at its current price of $26,950. Therefore, it is crucial that the bullish pressure above $26,500 is maintained, so as to avert a potential decline below $25,000 and even lower in the next few days. Moreover, should the opposite be the case, and the bulls reject the bearish pressure, $30,000 could be easily be attained.
What to Expect from Bitcoin (BTC)
As the daily chart reveals, the fact remains that bulls are guarding against any deeper drawback positively. So, if the history could repeat itself, BTC/USD is most likely gearing up for a run to at least $30,000 in the next positive moves. However, it’s important to note that the market’s trading volume is building up now, which simple means that the Bitcoin price is less likely to experience sudden crashes. Meanwhile, the support levels are located at $24,000, $23,800, and $23,600.
However, it seems that most factors are in favor of Bitcoin for the coming year 2021, especially immediately after the digital asset broke above $20,000 resistance level. But based on the significant growth in the outgoing year 2020, the next year 2021 should be highly beneficial for the Bitcoin and the entire cryptocurrency market. As the technical indicator RSI (14) confirms, if the Bitcoin price breaks above the channel, it may likely reach the resistance levels of $30,000, $30,200, and $30,400 respectively.
BTC/USD Medium – Term Trend: Bullish (4H Chart)
Looking at the 4-hour chart, the bears have been trying to step back into the market, but the bulls are defending the $26,000 support as well. Meanwhile, the $25,600 and below may come into play if BTC breaks below the mentioned support.
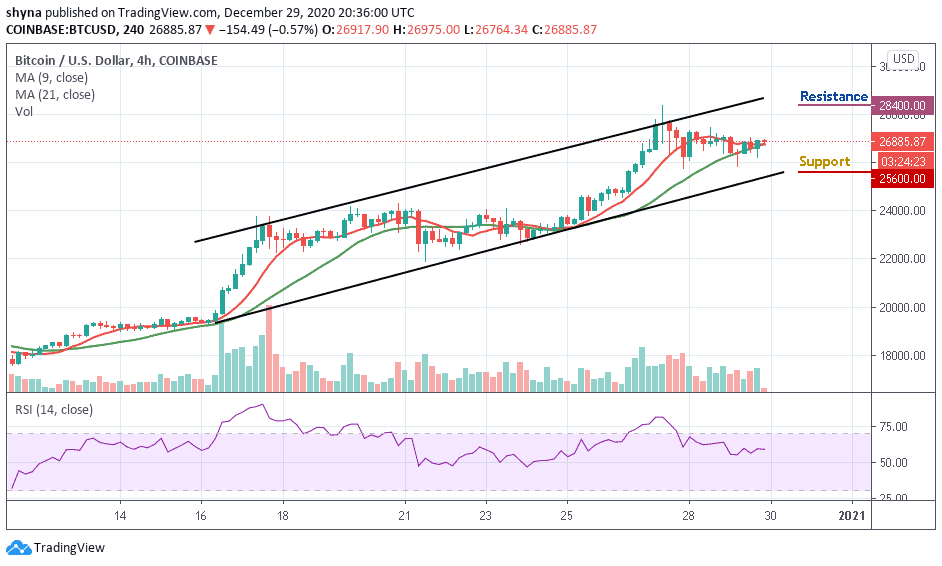
However, in as much as the buyers can reinforce and push the market towards the north, traders can expect a retest at $28,200 resistance level and breaking this level may further allow the bulls to reach $28,400 and above. However, the technical indicator RSI (14) is moving in the same direction, suggesting sideways movement.
Join Our Telegram channel to stay up to date on breaking news coverage