Join Our Telegram channel to stay up to date on breaking news coverage
Bitcoin (BTC) Price Prediction – December 23
At the time of writing, Bitcoin (BTC) is trading around $23,936 after recording a dip at $21,913 a couple of days ago.
BTC/USD Long-term Trend: Bullish (Daily Chart)
Key levels:
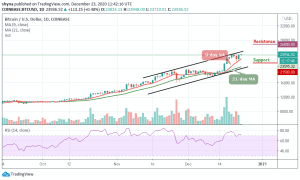
Resistance Levels: $26,800, $27,000, $27,200
Support Levels: $21,500, $21,300, $21,100
After a tremendous bullish movement this month, BTC/USD continues to trade above the 9-day and 21-day moving averages, facing hurdles at the $24,000. As of now, Bitcoin has been aiming to fall again, but the key support is becoming a threat to the bears. However, the king coin is preparing to cross above the upper boundary of the channel with a gain of 0.48% in the last few trading hours.
Would Bitcoin Go Up or Down?
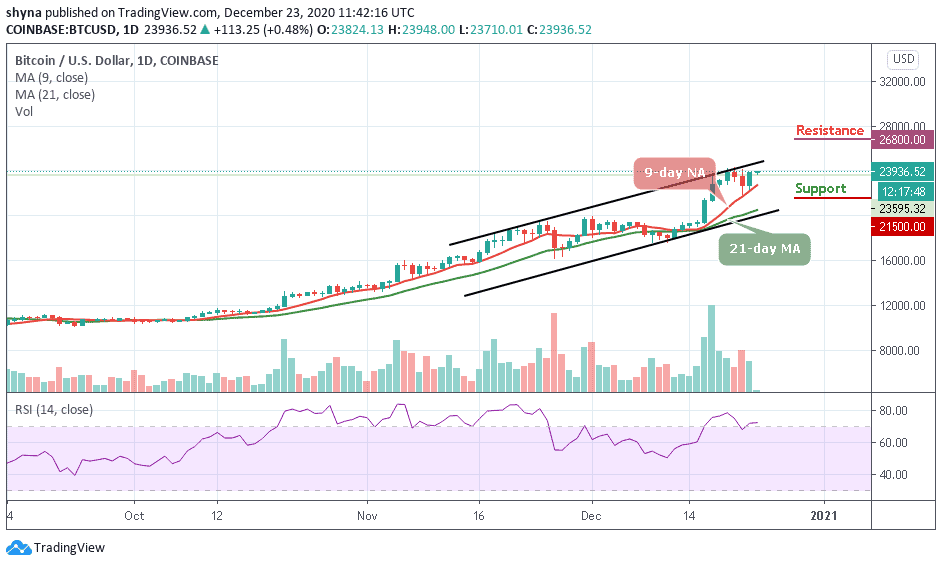
At the time of writing, Bitcoin is moving above the moving averages on the daily chart. After falling to $23,710 support, BTC/USD makes a quick price jump towards the upper boundary of the channel, from where the bulls may resume pressure. Now, the price is hovering around the $23,936 level, any bearish movement below this level, then, the $21,500, $21,300, and $21,100 supports may come into play.
However, if the 9-day MA can continue to provide support for the market, traders can expect the price to climb back to $24,100 resistance before climbing above the channel to meet $26,800, $27,000 and 27,200 resistance levels. Meanwhile, the technical indicator RSI (14) remains within the overbought zone, suggesting bullish signals.
BTC/USD Medium – Term Trend: Ranging (4H Chart)
Looking at the 4-hour chart, the Bitcoin (BTC) falls below the moving averages but bulls are making efforts to defend the $23,000 support as well. Meanwhile, the $22,000 and below may come into play if BTC breaks below the mentioned support.
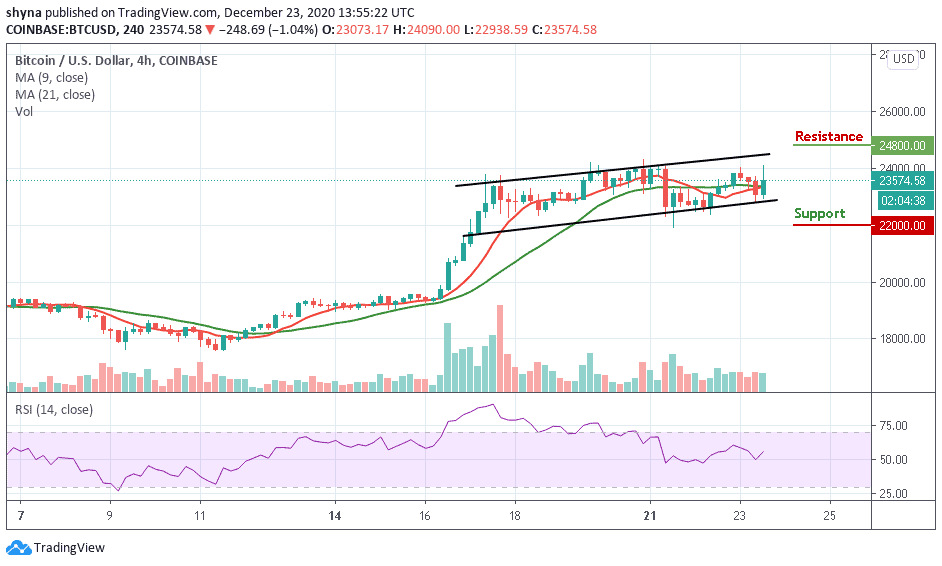
Moreover, if the buyers can gather more momentum to power the market and move the coin to the higher high, traders may expect a retest at a $24,300 resistance level, and breaking above this level may push the price towards the resistance level of $24,800 and above. Meanwhile, the technical indicator RSI (14) is moving above the 50-level, suggesting more bullish movement.
Join Our Telegram channel to stay up to date on breaking news coverage