Join Our Telegram channel to stay up to date on breaking news coverage
Bitcoin (BTC) Price Prediction – December 17
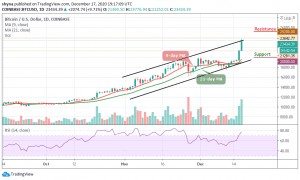
BTC/USD is currently trading around the upper boundary of the channel as the king coin hits an intraday high of $23.776.
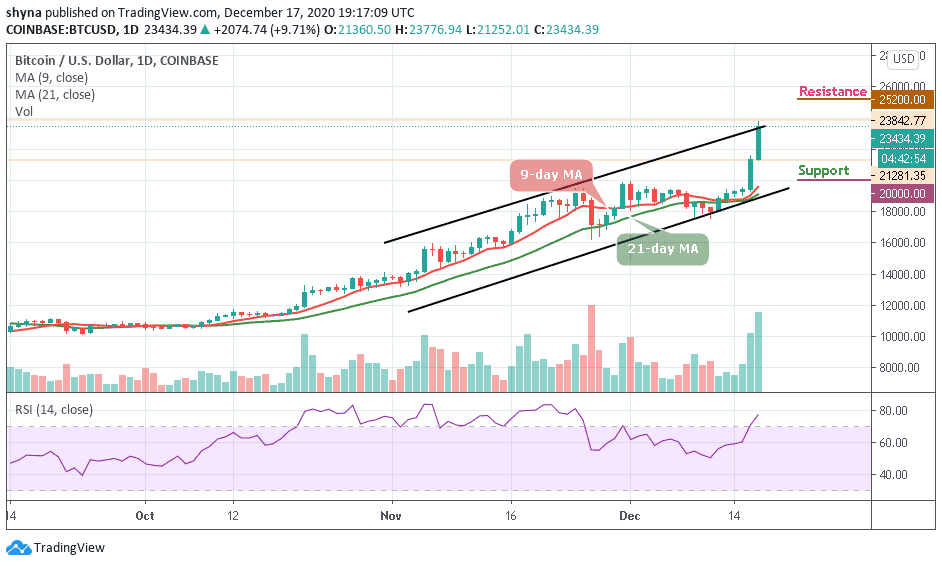
BTC/USD Long-term Trend: Bullish (Daily Chart)
Key levels:
Resistance Levels: $25,200, $25,400, $25,600
Support Levels: $20,000, $19,800, $19,600
BTC/USD breached the important $23,000 resistance level today after hitting the $22,000 level. At the time of writing, the first digital asset is trading at a price of $23,434, having gained by 9.71% in the last 12 hours. However, Bitcoin’s current price now reflects that the cryptocurrency is comfortably seated, even though it had successfully crossed the 9-day and 21-day moving averages.
Where is BTC Price Going Next?
The bulls need to work hard to surpass key hurdles at this crucial point, else, the king coin could easily fall below $21,000 should the bearish pressure overtake the market. Previously, the price range between $18,000 and $19,800 acted as support. Therefore, for Bitcoin price prediction to turn more bullishly, buyers must retain the bullish momentum for the market price to reach the resistance levels of $25,200, $25,400, and $25,600.
However, the bullish momentum would certainly give the altcoins a much-needed boost and calm the cryptocurrency market as well. For Bitcoin to be rejected at $23,776 may eventually lead to declines below the support of $21,500. Should in case the coin drops more, then it could rely on the long-term support levels at $20,000, $19,800, and $19,600 but the RSI (14) moves into the overbought region.
BTC/USD Medium-term Trend: Bullish (4H Chart)
The long bullish candle on the 4-hour chart shows that bulls had their say at the end of yesterday. However, the movement above the 9-day and 21-day moving averages shows there are confidence and liquidity in bulls to take the move forward today.
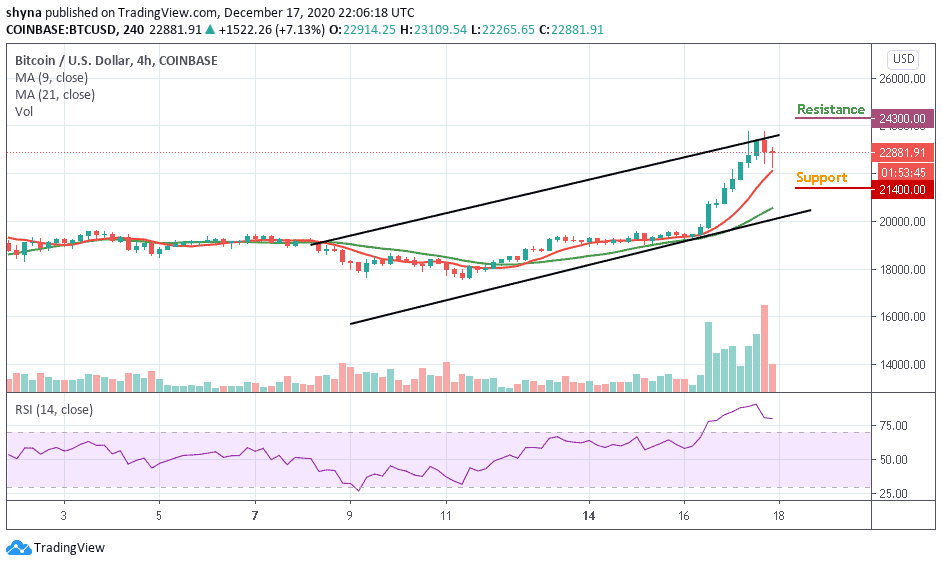
Moreover, if the current bullish move falters, profit booking may bring the price down towards the support level of $21,400 and below. However, bulls could support the price above $22,500 as they have done successfully in the past few days. But if the market price rises above the upper boundary of the channel, it may reach the resistance levels of $24,300 and above. The RSI (14) is seen moving within the overbought conditions.
Join Our Telegram channel to stay up to date on breaking news coverage