Join Our Telegram channel to stay up to date on breaking news coverage
Bitcoin (BTC) Price Prediction – December 3
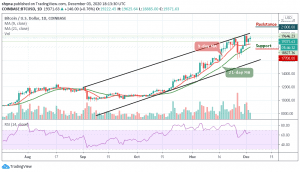
Currently, the daily chart reveals that BTC/USD lacks strong resistance on the upside.
BTC/USD Long-term Trend: Bullish (Daily Chart)
Key levels:
Resistance Levels: $21,000, $21,200, $21,400
Support Levels: $17,700, $17,500, $17,300

Today, BTC/USD touches the daily high at $19,625 to face a key resistance of $20,000 but it’s been rejected and now trading sideways. However, if the first digital asset continued to consolidate in this way, traders could soon see it break through the above-mentioned level of key resistance and it could then be obvious to target the potential resistance of $20,500. In other words, traders may see a larger decline in the coming days if the coin breaks below the 9-day and 21-day moving averages.
Possible Next Direction for BTC/USD
The Bitcoin price in the consolidation mode above the 9-day and 21-day moving averages, deciding on the next move. In addition, it can be expected that the market may begin to sell should in case the coin break below the moving averages. Therefore, if the bulls continue to show a strong commitment, BTC/USD could rise above the upper boundary of the channel and may reach the potential resistance levels of $21,000, $21,000, and $21,400 as the RSI (14) indicator, while on the positive side, may continue to give bullish signals.
At the moment, the daily chart shows that the weak upward momentum may be affecting the Bitcoin bulls, although bears may likely bring the price below the moving averages which could lead the Bitcoin price to the supports of $17,700, $17,500, and $17,300 in the next negative moves.
BTC/USD Medium-Term Trend: Bullish (4H Chart)
The 4-hour chart shows that the Bitcoin price touches the daily high at $19,300; this barrier may likely slow down the bulls as the coin may consolidate around the 9-day and 21-day moving averages before breaking below the channel to reach the critical support at $18,200 and below as the technical indicator RSI (14) moves below 60-level.
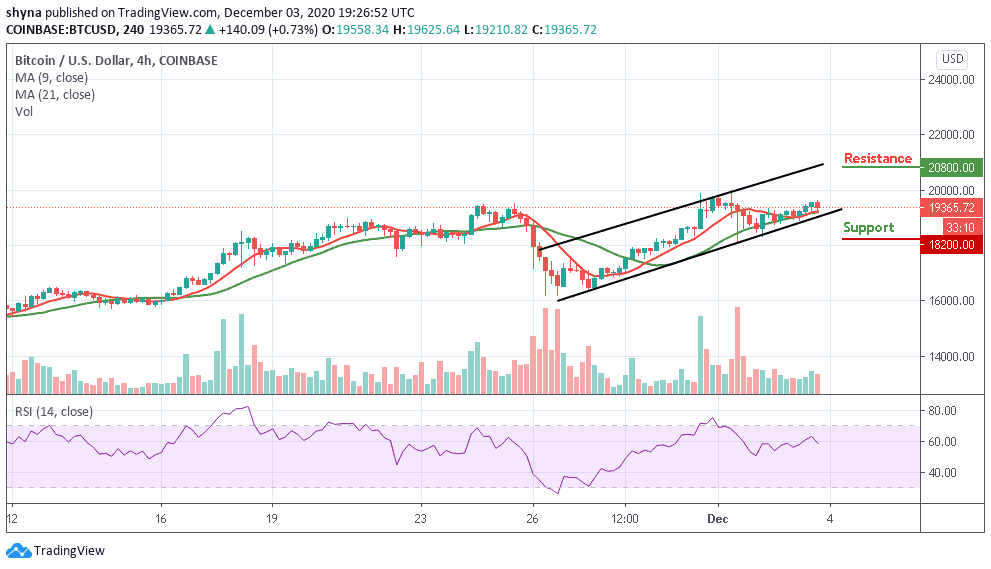
On the upside, if the market price maintains the uptrend and the technical indicator confirms it, the nearest resistance levels may come at $20,800 and $21,000.
Join Our Telegram channel to stay up to date on breaking news coverage