Join Our Telegram channel to stay up to date on breaking news coverage
Bitcoin (BTC) Price Prediction – November 27
The Bitcoin price is reeling after rejection at the retest of its all-time high.
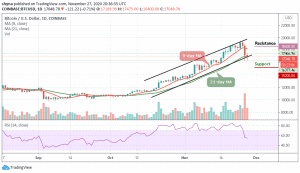
BTC/USD Long-term Trend: Bullish (Daily Chart)
Key levels:
Resistance Levels: $18,600, $18,800, $19,000
Support Levels: $15,200, $15,000, $14,800

At the time of writing, BTC/USD is trading down just under 0.71% at its current price of $17,048. This marks a rebound from daily lows of $16,400 with a decline from highs of over $17,000. However, it has been a rough past few days with the Bitcoin price seeing immense sell-side pressure as the bears aim at erasing the gains that have come about.
What is the Next Direction for Bitcoin?
Today marks the third day in a row that Bitcoin has failed to break above the $19,500 resistance level as it looks to set up another few days of negative price declines beneath $17,000. A break above the upper boundary of the channel would have set Bitcoin up to reach the $20,000 level. On the upside, if there are upsides break above the moving averages, the Bitcoin price could have recovered towards the $18,000 level.
However, the main resistance levels for the bulls are located at $18,600, $18,800, and $19,000. Nevertheless, if there is a downside break below the lower boundary of the channel at $16,000, the price may accelerate decline towards the $15,200, $15,000, and $14,800 support levels as the technical indicator RSI (14) is seen moving below 55-level.
BTC/USD Medium-Term Trend: Bearish (4H Chart)
The 4-hour chart shows that the Bitcoin bears are now stepping back into the market pushing the BTC price below its previous support level that existed around $17,100. The Bitcoin price is in the loop of making a bounce back above the daily low of $16,751. Its price hovers around $17,013 and may take time to persistently trade above $17,500.
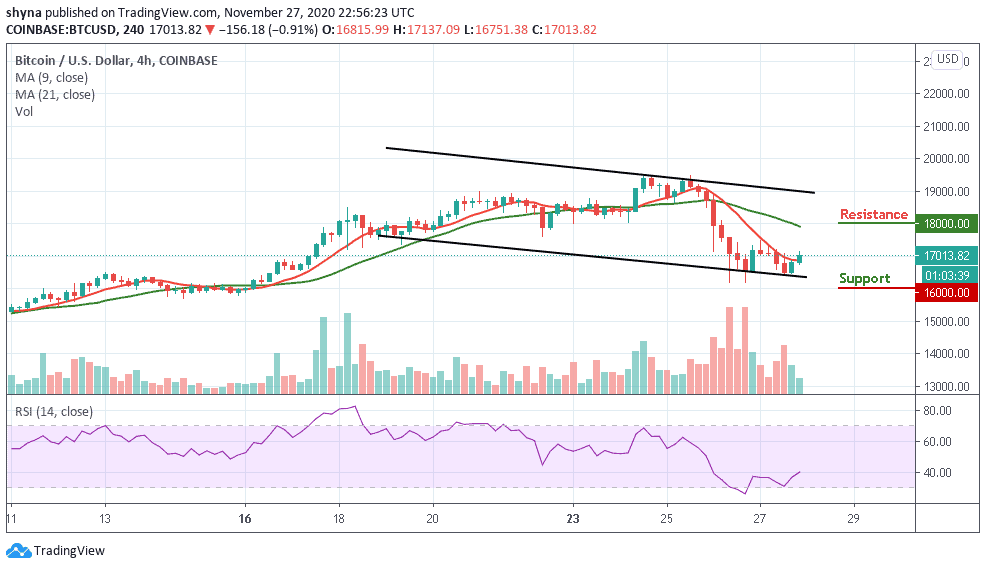
At the moment, BTC/USD is currently trading around the 9-day moving average but still below the 21-day moving average. The upward movement may likely push the price nearest resistance at $18,000, $18,200, and $18,400 resistance levels while the immediate support lies at $16,000, $15,800, and $15,600. The RSI (14) moves to cross above the 40-level, which may likely introduce more bullish trends into the market.
Join Our Telegram channel to stay up to date on breaking news coverage