Join Our Telegram channel to stay up to date on breaking news coverage
Bitcoin (BTC) Price Prediction – November 25
The Bitcoin price continues to follow the bearish movement as the price drops below $18,850.
BTC/USD Long-term Trend: Bullish (Daily Chart)
Key levels:
Resistance Levels: $20,600, $20,800, $13,000
Support Levels: $17,800, $17,600, $17,400
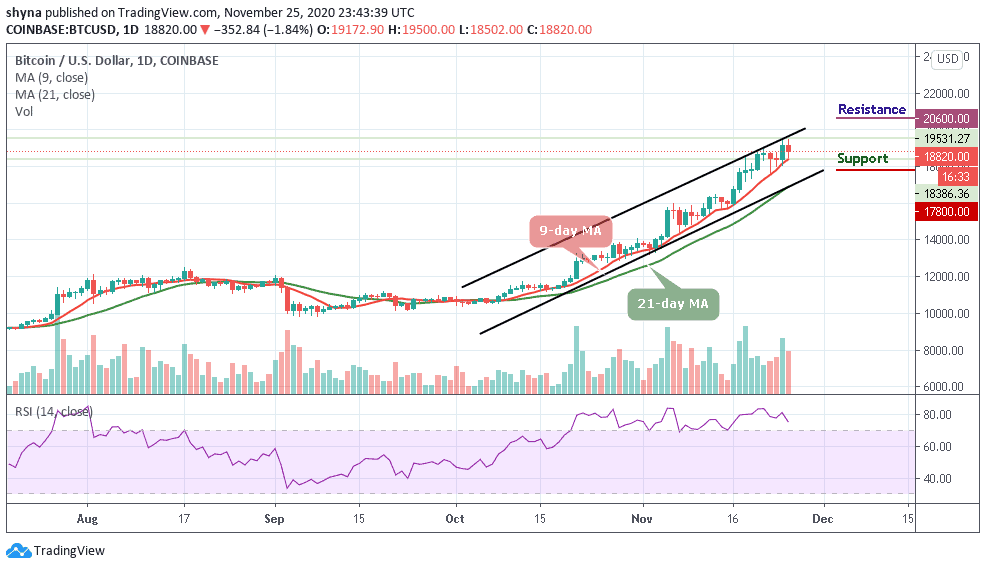
BTC/USD is hovering at $18,820. There have been instances when BTC has exchanged hands below $18,550 sustaining the bearish price action is a downhill task. As the daily chart reveals, the path of least resistance is still downwards with the formation of a bearish pennant pattern.
Where is BTC Price Going Next?
The technical indicator RSI (14) reveals that the market movement is bearish. Despite the drop suffered, the technical indicator remains within the overbought zone. This could mean that there is still room that may be explored by the bears. Therefore, BTC/USD may continue to follow the downtrend if the market price crosses below the 9-day moving average.
On the upside, recovery may not come easy but any attempt to cross above the upper boundary of the channel may negate the bearish scenario and allow for an extended recovery towards the resistance levels at $20,600, $20,800, and $13,000. However, an increase in selling pressure across the market could force the Bitcoin price to follow a painful path towards the support levels of $17,800, $17,600, and $17,400.
BTC/USD Medium-Term Trend: Ranging (4H Chart)
On the 4-hour chart, the Bitcoin bulls have not been able to push the market price above the 9-day moving average. The chart reveals that the coin survived the $18,500 support as the market rebounds from the low of $18,502. However, the Bitcoin price is likely to return to the bull market if the price breaks above the $19,000 level. Higher resistance is located at $19,500 and above.
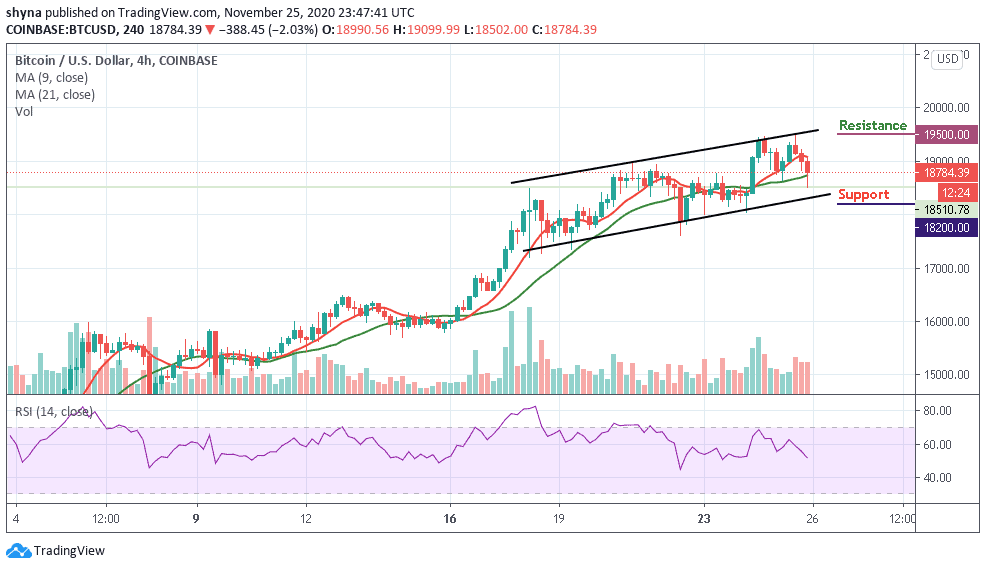
Moreover, if the price drops below the 21-day moving average, even $18,500 may not be able to hold the support as the RSI (14) faces the south. Therefore, the king coin is likely to fall visit the $18,200 and below if the price breaks below the lower boundary of the channel.
Join Our Telegram channel to stay up to date on breaking news coverage