Join Our Telegram channel to stay up to date on breaking news coverage
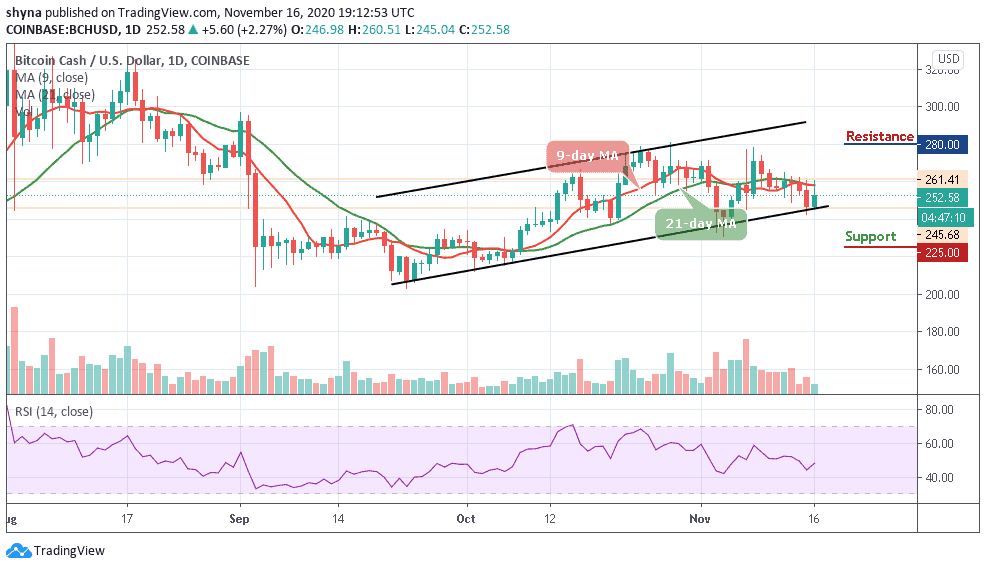
Bitcoin (BTC) Price Prediction – November 17
The Bitcoin (BTC) is clearly in a full-blown bull market, with each dip being aggressively absorbed by the bulls as it continues grinding higher.
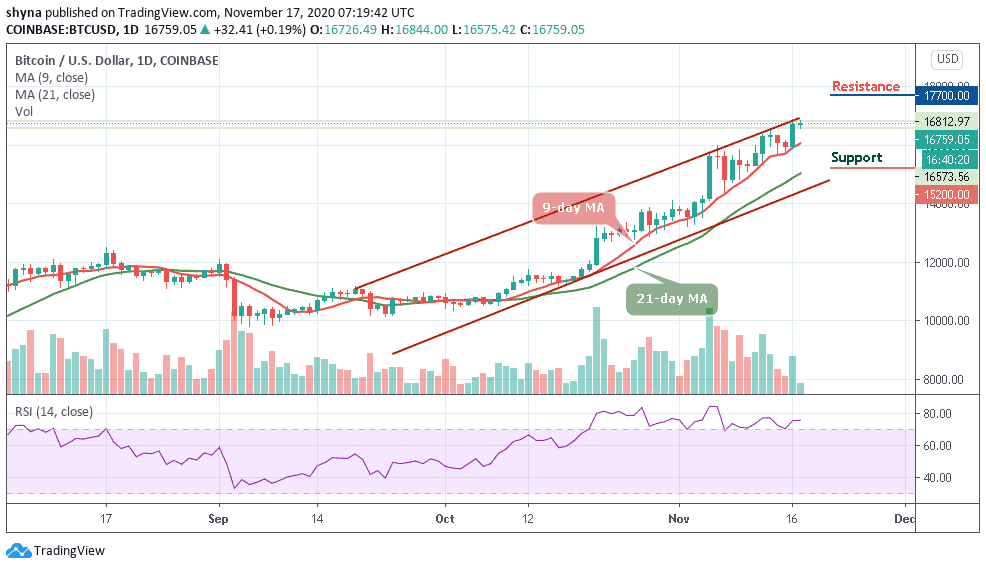
BTC/USD Long-term Trend: Bullish (Daily Chart)
Key levels:
Resistance Levels: $17,700, $17,900, $18,100
Support Levels: $15,200, $15,000, $14,800
Presently, BTC/USD stands within the overbought region which is too risky to buy at the current levels; therefore, it must undergo a downside correction before determining its next bias. The bears have tried to gain control of the benchmark digital asset on multiple occasions, but they have been wholly unable to do so. More so, the bears are now waiting for the cryptocurrency to initiate the next correction so they could confidently gear up to target lower price levels.
Where is BTC Price Going Next?
The Bitcoin price level has long been strong resistance as it has been able to post what appears to be a firm and sustainable break above the 9-day and 21-day moving averages. BTC/USD is still facing a tough level that could lead to the $17,000 level but it is about to see a golden cross which is likely to occur in future trading. If this eventually happens, BTC may hit $17,700, $17,900, and $18,100 resistance levels.
However, BTC/USD was seen sliding lower after touching $16,844 today. Trading below this level may signal a selling pressure that could hit the market movement. Meanwhile, the leading cryptocurrency is currently trading around $16,759; any bearish movement below the 9-day moving average could hit the critical supports at $15,200, $15,000, and $14,800 respectively.
BTC/USD Medium-Term Trend: Bullish (4H Chart)
On a 4-hour chart, BTC/USD must remain above the 9-day and 21-day moving averages to keep maintaining the bullish pressure and allow for an extended recovery towards $17,000. In addition, a higher resistance level may be found at $17,200 and above.

In other words, the nearest support is below the 9-day moving average at $16,400, and a sustainable move below this level may increase the downside pressure to the support level of $16,300 and below. Meanwhile, the technical indicator RSI (14) is staring at the upside, as the signal line moves around the 66-level.
Join Our Telegram channel to stay up to date on breaking news coverage