Join Our Telegram channel to stay up to date on breaking news coverage
BCH Price Prediction – November 16
The Bitcoin Cash price is showing an amazing intraday hike as it rises from $246 to touch the daily high at $260.
BCH/USD Market
Key Levels:
Resistance levels: $280, $290, $300
Support levels: $225, $215, $205
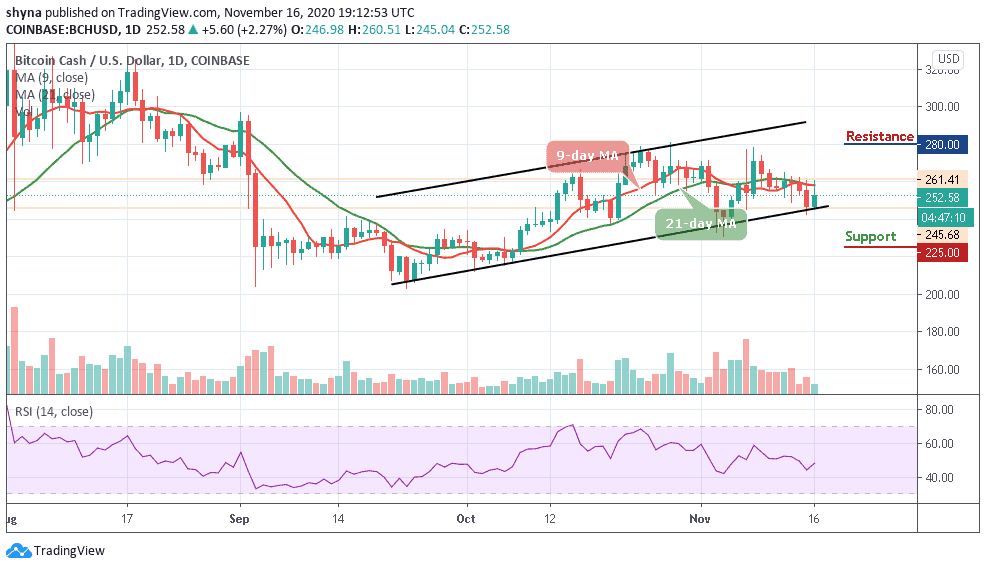
BCH/USD is currently hovering at $252.58 after touching the daily at $260.51. The BCH price is seen focusing on the bullish momentum after a sustainable break above the 9-day and 21-day moving averages. More so, the coin is gaining over 2.27% within 24 hours as it is using $245 support as a jumping-off ground to develop the upside momentum, which is now gaining traction.
Where is BCH Price Going Next?
On the upside, if BCH/USD moves above the moving averages once again, the market price may likely break into another resistance at $265 and $275 respectively. Similarly, the technical indicator RSI (14) shows that the bulls are ready for action. Therefore, any further bullish movement may pave the way to the resistance levels of $280, $290, and 300.
On the other hand, if the price falls below the lower boundary of the channel, the market may be compelled either to a range-bound or begin a downward movement and this may serve as a major blow for the market sentiments as traders could interpret it as a sign of underlying weakness. The next available support may come at $235, which could be followed by $225, $215, and $205 support levels.
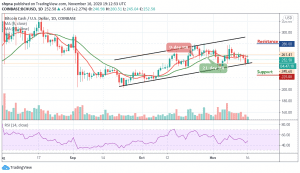
Against BTC, as revealed in the daily chart, the bears are seen in action, pulling down the market price. However, following the recent negative sign, the pair may continue to follow the downtrend if the buyers failed to push the price above the 9-day and 21-day moving averages.

However, as the technical indicator RSI (14) moves within the oversold zone, the market may remain at the downside but once it moves out of this zone, the market price may likely resume an upward trend which may push the price towards the resistance level of 0.017 BTC and above but a retest could lower the price to 0.13 BTC and below.
Join Our Telegram channel to stay up to date on breaking news coverage