

Join Our Telegram channel to stay up to date on breaking news coverage
Bitcoin (BTC) Price Prediction – November 15
The Bitcoin price is seen dropping by a total of 1.29% within 24 hours as it trades at the $15,874 support level.
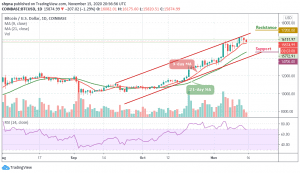
BTC/USD Long-term Trend: Bullish (Daily Chart)
Key levels:
Resistance Levels: $17,200, $17,400, $17,600
Support Levels: $14,700, $14,500, $14,300

After touching a new yearly high of $16,491 a couple of days ago, BTC/USD now seems to be retracing. The first digital asset dropped to as low as $15,820 and recovered to where it’s currently trading at $15,874. However, it’s completely typical and healthy market behavior for prices to correct because this gives buyers the opportunity to consolidate and continue accumulating.
Where is BTC Price Going Next?
Today marks the second day in a row that Bitcoin has failed to break above this ascending channel as it looks to set up another few days of negative price declines beneath $15,900. A break above the channel would have set Bitcoin up to reach the $17,000 level but the technical indicator RSI (14) prepares to move out of the overbought region and this may likely cause the market price to hit the supports at $14,700, $14,500, and $14,300 respectively.
Today, the daily price touches the high of $16,175 but now drops beneath the $16,000 level. Although the current candlestick is yet to close, however, it does look unlikely that the bulls may end up closing above this resistance. More so, toward the upside, resistance lies at $17,200, $17,400, and $17,600.
BTC/USD Medium-Term Trend: Bullish (4H Chart)
The 4-hour chart shows that the Bitcoin bears are now stepping back into the market pushing the BTC price below the 9-day and 21-day moving averages at $15,853. Although the Bitcoin price has not yet slipped below $15,800, it’s still in the loop of making a bounce back and may take time to persistently trade above $16,000.
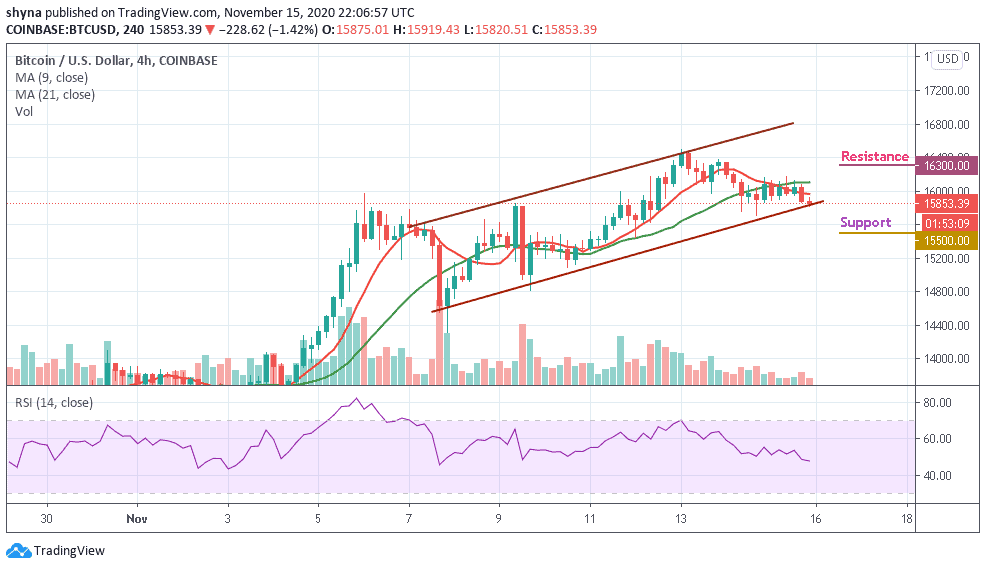
At the moment, BTC/USD is currently moving below the moving averages. The upward movement may likely push the price nearest resistance at $16,300, $16,500, and $16,700 resistance levels while the immediate support lies at $15,500, $15,300, and $15,100. The RSI (14) moves below the 48-level, which indicates more bearish signals may play out.
Join Our Telegram channel to stay up to date on breaking news coverage
