Join Our Telegram channel to stay up to date on breaking news coverage
Bitcoin (BTC) Price Prediction – November 8
The Bitcoin (BTC) battles the resistance at $15,500 amid an impending breakout to new yearly highs.
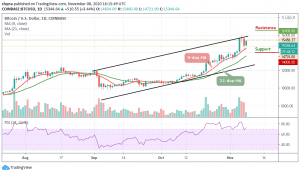
BTC/USD Long-term Trend: Bullish (Daily Chart)
Key levels:
Resistance Levels: $16,500, $16,700, $16,900
Support Levels: $14,000, $13,800, $13,600

BTC/USD is hovering around the $15,344 level after touching the daily high of $15,460. Meanwhile, the coin has not been able to climb the $16,000 as neither the bulls nor the bears are looking to hold the price by the scruff of its neck. Actually, all this may soon change, though. Moreover, the Bitcoin price needs to keep going strong and pointing towards an upside breakout.
Where is BTC Price Going Next?
According to the daily chart, consolidation is expected to take precedence in the coming sessions, as highlighted by the technical indicator RSI (14). Meanwhile, it is more likely that BTC/USD could extend the price action above $15,500 and this is a move that is likely to call for more buy orders, increasing the price movement and pulling Bitcoin to new yearly highs. However, a breakout above $16,000 could boost confidence in the coin and increase overall liquidity into the system.
For now, Bitcoin’s rise could certainly give the other altcoins a much-needed boost and aid the bullish movement in the market as well. For Bitcoin to be rejected at $15,800 may eventually lead to declines below the 9-day moving average at $14,500. Should in case the coin drops more, then it could rely on the long-term support levels at $14,000, $13,800, and $13,600 but as the RSI (14) moves within the overbought, the potential resistance levels may be located at $16,500, $16,700, and $16,900.
BTC/USD Medium-term Trend: Bullish (4H Chart)
The bullish candle on the 4-hour chart shows that the bulls are having their say at the market movement. As it stands now, the movement above the 9-day and 21-day moving averages shows that there are confidence and liquidity in bulls to take the Bitcoin price forward today. Moreover, it seems that the Bitcoin price prediction is approaching the bullish confirmation at the time of writing.
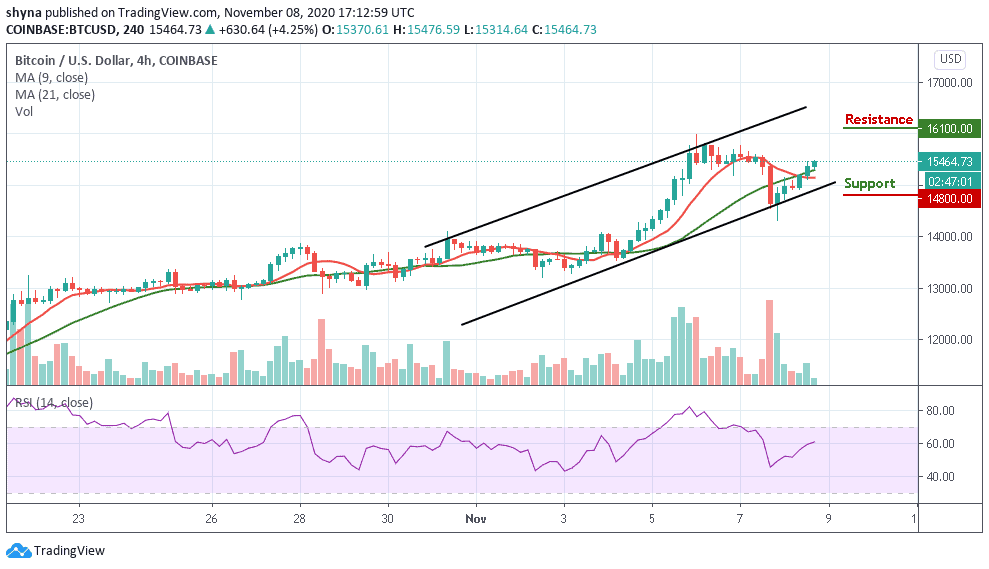
Moreover, if the current bullish move falters, profit booking may bring the price down towards the support level of $14,800 and below. However, bulls could support the price above $15,500 as they have done successfully in the past few days. But if the market price rises towards the upper boundary of the channel, it may reach the resistance levels of $16,100 and above. The RSI (14) is seen moving above 60-level, indicating an uptrend movement.
Join Our Telegram channel to stay up to date on breaking news coverage