Join Our Telegram channel to stay up to date on breaking news coverage
Bitcoin (BTC) Price Prediction – November 6
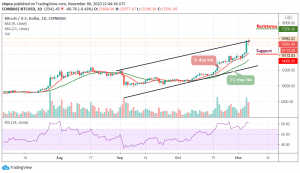
Bitcoin bulls are working hard to nurture a bullish trend from the support at $15,000.
BTC/USD Long-term Trend: Bullish (Daily Chart)
Key levels:
Resistance Levels: $17,200, $17,400, $17,600
Support Levels: $14,000, $13,800, $13,600
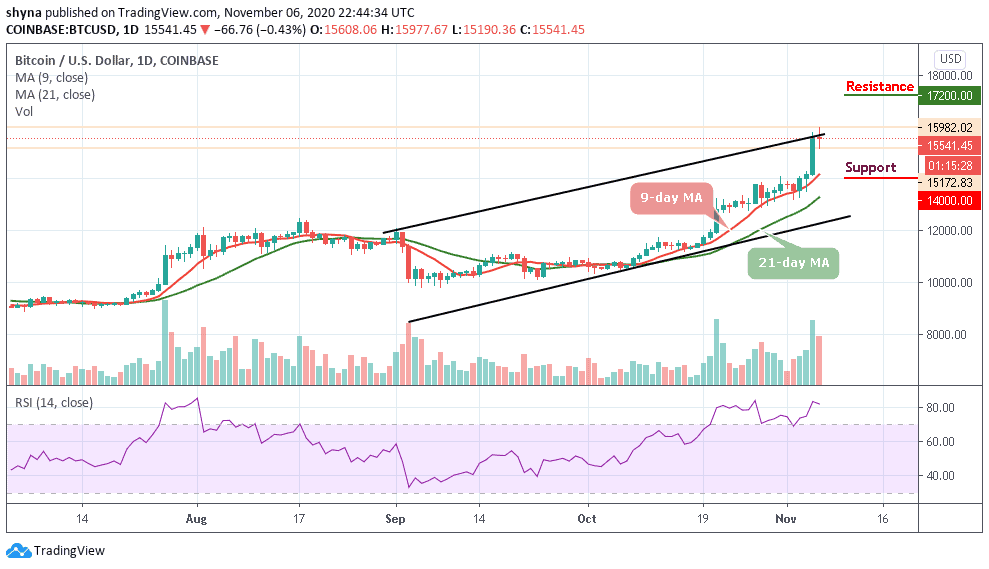
Bitcoin is currently trading 0.43% lower on the day. BTC/USD opens the session at $15,608 and now adjusting upwards to the prevailing market value of $16,000. More so, the Bitcoin price is moving within the short-term bullish trend amid low volatility. Meanwhile, the current conditions imply that the price may stay range-bound in the next few moves as the coin trades above the 9-day and 21-day moving averages. Similarly, the technical indicator RSI (14) remains within the overbought zone.
Where is BTC Price Going Next?
At the opening of the market today, after testing the low of $15,190, BTC/USD is currently trading at $15,541. Looking at the market movement, there is likely that the coin may experience a quick retracement if it moves above the channel to touch the crucial $16,000 resistance, and traders may see $15,200 to $15,000 being tested again before pushing higher.
On the downside, if the market decides to fall, the price of Bitcoin could fall below the support level of $14,500, and if that support fails to hold the sell-off, traders could see a further decline below the 9-day MA and move towards the support levels of $14,000, $13,800, and critically $13,600. All the same, any further bullish movement above the upper boundary of the channel may hit the resistances at $17,200, $17,400, and $17,600 respectively.
BTC/USD Medium – Term Trend: Bullish (4H Chart)
On the 4-hour chart, we expect the coin to gain the lost momentum and hit the trade above $16,000. Meanwhile, the volatility hovers, and the selling pressure still exists and this may cause the coin not to be able to cross above the upper boundary of the channel. Meanwhile, the $14,800 and below may come into play if BTC breaks below moving averages.
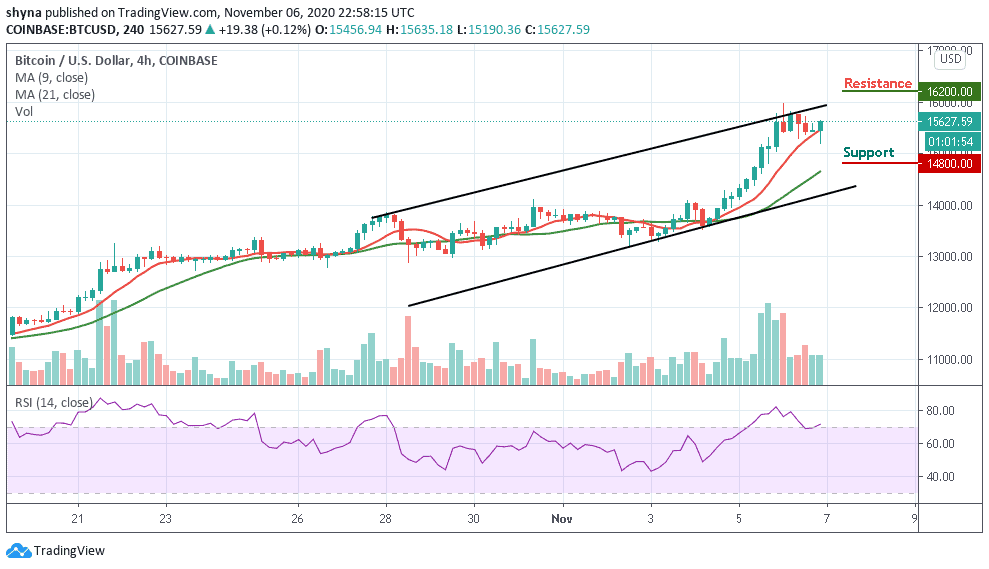
However, in as much as the buyers reinforce and power the market, traders can expect a retest at the $15,900 resistance level, and breaking this level may further allow the bulls to reach $16,200 and above. The RSI (14) is seen trading within the overbought territory which shows that more bullish signals may play out.
Join Our Telegram channel to stay up to date on breaking news coverage