Join Our Telegram channel to stay up to date on breaking news coverage
Bitcoin (BTC) Price Prediction – October 30
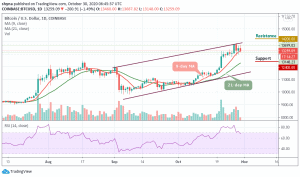
The Bitcoin (BTC) is in the process of surging back up towards its key $13,800 resistance level.
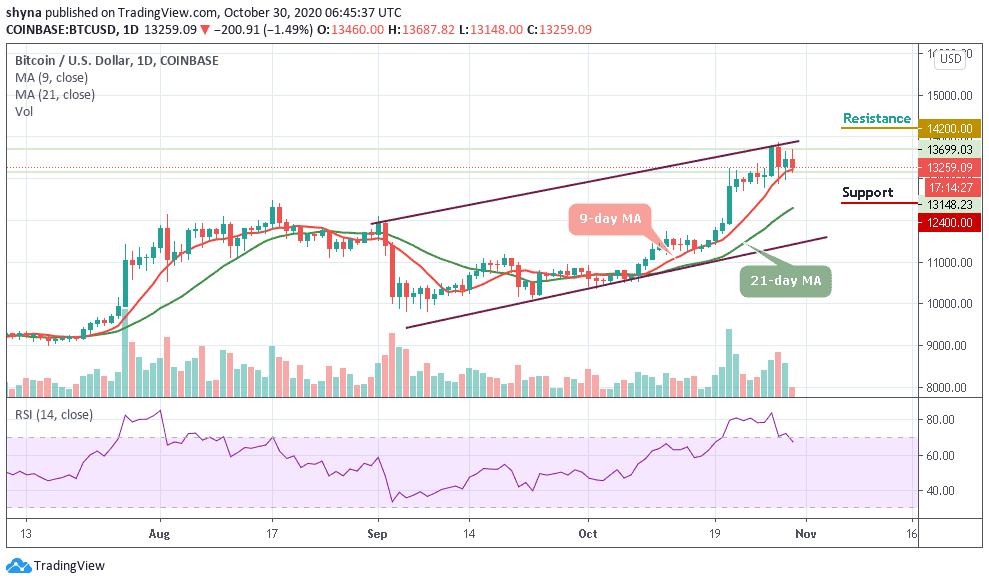
BTC/USD Long-term Trend: Bullish (Daily Chart)
Key levels:
Resistance Levels: $14,200, $14,400, $14,600
Support Levels: $12,400, $12,200, $12,000
Yesterday, many saw a sharp downside correction in BTC/USD below the $13,500 support level. Moreover, the Bitcoin price even broke the $13,200 support level and spiked below $13,000. However, dips were limited below the $13,000 support as the price bounced back sharply to move back into a positive zone. There was also a break above the $13,500 resistance and the price settled nicely above the 9-day and 21-day moving averages.
What to Expect from Bitcoin (BTC)
The Bitcoin price is now facing another support at $13,100. It already made two attempts to gain strength above $13,300, but failed. The recent high formed near $13,687 and the price is currently correcting lower. There is major support forming on the downside near the $13,300 level and below the 9-day moving average. If Bitcoin fails to clear the $13,500 and $13,700 resistance levels, there is a risk of a downside break as the technical indicator RSI (14) moves out of the overbought condition.
However, the first key support is near the $12,800 level and a downside break below this level could spark a fresh increase in selling. In the stated case, the bears may perhaps attempt a bearish break below the 21-day moving average at $12,400, $12,200, and $12,000 respectively. On the upside, the bulls need to clear the $13,600 and $13,800 resistance levels to continue higher. In the stated case, the price could easily drift towards the $14,000 resistance and any further bullish movement could push the coin to the resistance level of $14,200, $14,400, and $14,600.
BTC/USD Medium – Term Trend: Bullish (4H Chart)
A few days ago, the Bitcoin price surged upwards of over $200 at the opening of the trade, catapulting its price from $13,460 to reach around $13,687. After the sudden rise, the coin started dropping in price to where it’s trading currently at $13.303. Should the price continue to drop further, it could reach the nearest supports at $13,000, $12,800, and $12,600 respectively.
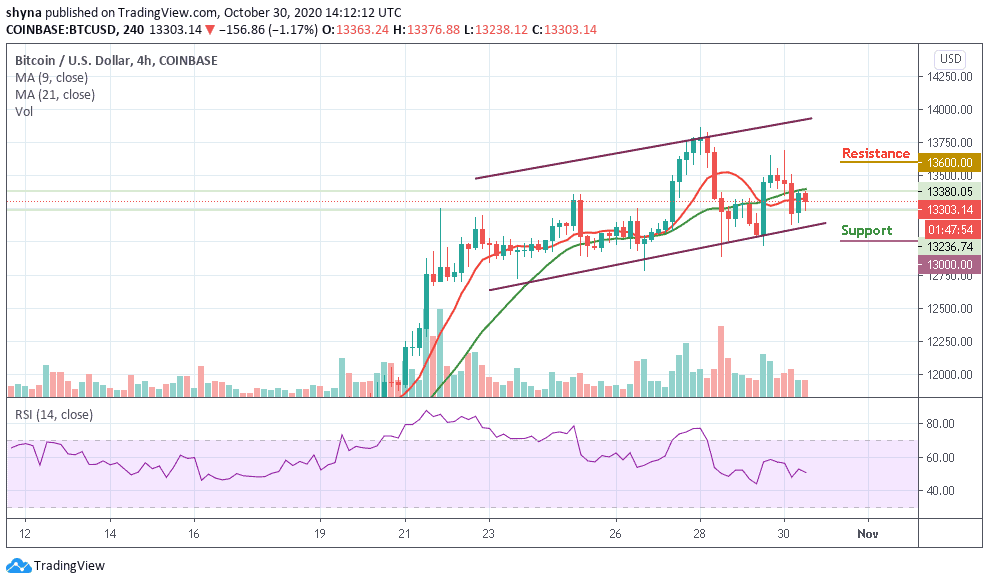
Moreover, if the bulls push the coin above the 9-day moving average, the price of Bitcoin could reach the nearest resistance at $13,500 before heading to the potential resistance levels of $13,600, $13,800, and $14,000. More so, the market may be indecisive as the RSI (14) indicator may start moving in sideways.
Join Our Telegram channel to stay up to date on breaking news coverage