Join Our Telegram channel to stay up to date on breaking news coverage
Bitcoin (BTC) Price Prediction – October 28
The Bitcoin faces a strong selloff that causes its price to clear most of the gains incurred in the past couple of days.
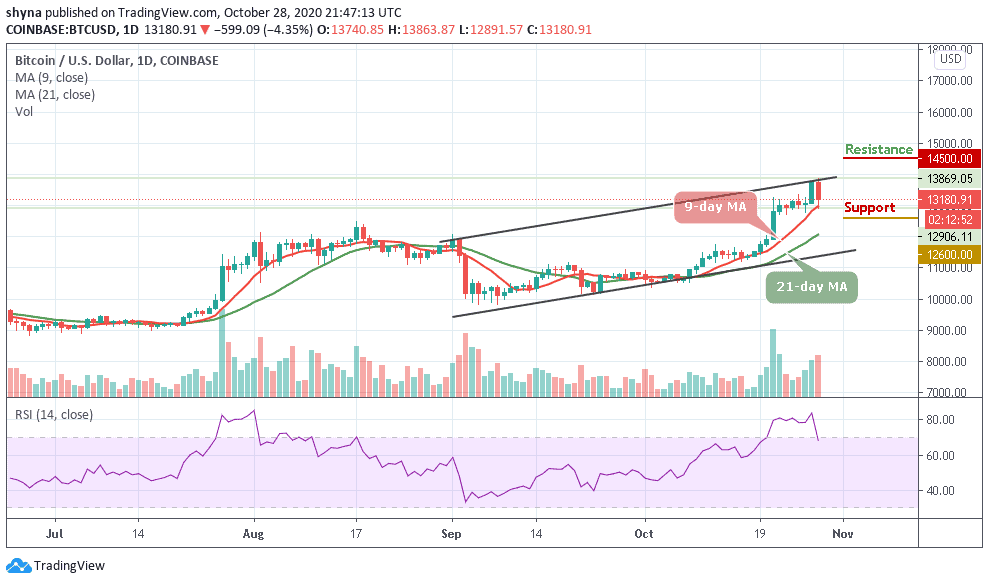
BTC/USD Long-term Trend: Bullish (Daily Chart)
Key levels:
Resistance Levels: $14,500, $14,700, $14,900
Support Levels: $12,600, $12,400, $12,200
For the past few hours, it has been rough for BTC/USD and the aggregated crypto market, as the number one cryptocurrency sees a harsh selloff after its price rallied as high as $13,863 in the early hours of today’s trading. However, the selling pressure at this price level is suggesting that it may be quite some time before traders or the investors see a sustained move above $14,000.
What is the Next Direction for Bitcoin?
At the time of writing, BTC/USD is seen trading down just over 4.3% at its current price of $13,180.91. Surprisingly, the price of Bitcoin hasn’t really dropped too much since the beginning of today. On the daily chart, after dipping below the $13,000, BTC quickly managed to recover and it’s now trading right above the 9-day moving average.
Meanwhile, where the market will trend in the next few days could determine the long-term significance of this Bitcoin’s rejection. But a sustained decline below the 9-day moving average could be a highly bearish sign when falling towards the 21-day moving average. The RSI (14) moves out of the overbought zone for bearish confirmation. Any further bearish movement may reach the supports at $12,600, $12,400, and $12,200 while the resistance levels may be located at $14,500, $14,700, and $14,900 respectively.
BTC/USD Medium – Term Trend: Bullish (4H Chart)
Looking at the 4-hour chart, Bitcoin’s price is currently trading around $13,228 and below the 9-day and 21-day moving averages after falling from $13,863 where the coin touched today. Looking at it technically, the short-term trend is in the hands of the sellers.
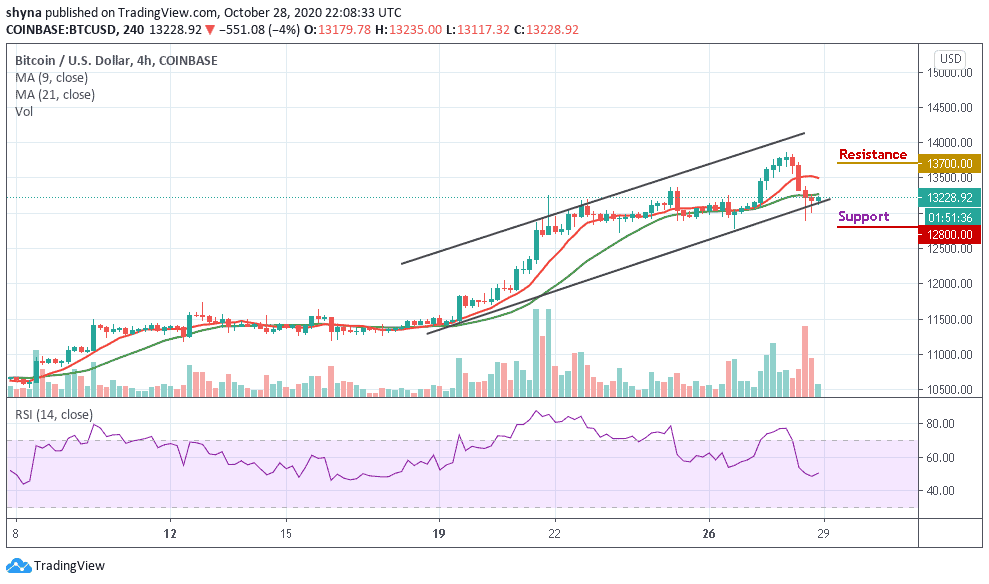
The technical indicator RSI (14) is trading around 50-level. As long as the downward trend continues, keeping Bitcoin above $13,500 may be a daunting task. In this case, the possible support levels are located at $12,800 and below while the potential resistance lies at $13,700 and above.
Join Our Telegram channel to stay up to date on breaking news coverage