

Join Our Telegram channel to stay up to date on breaking news coverage
Bitcoin (BTC) Price Prediction – April 21
BTC/USD rests at $55,300 after the retreat from $54,334 but the $53,000 level may likely come out as support.
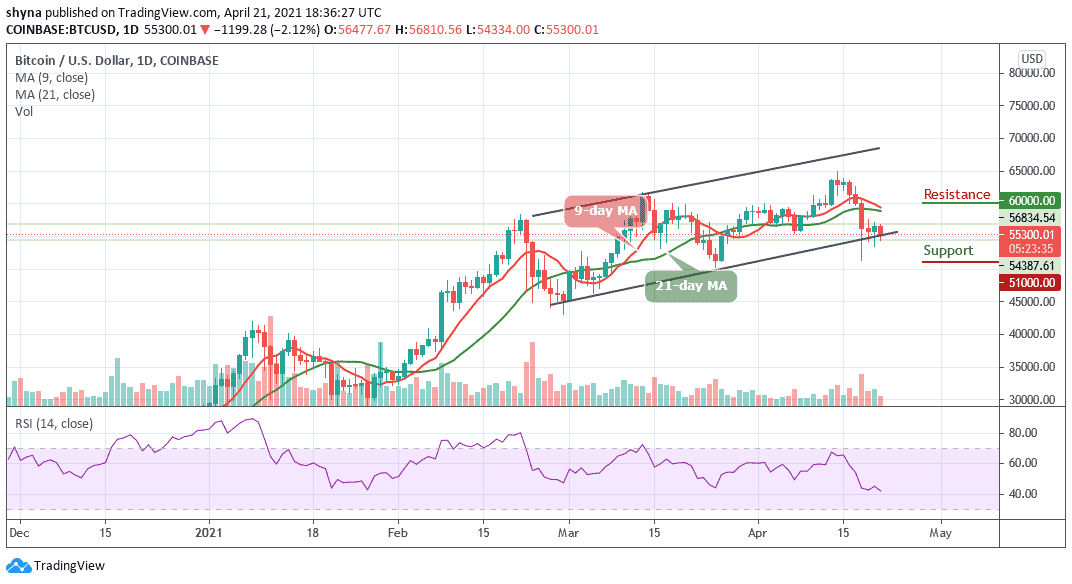
BTC/USD Long-term Trend: Bullish (Daily Chart)
Key levels:
Resistance Levels: $60,000, $62,000, $64,000
Support Levels: $51,000, $49,000, $47,000
At the time of writing, BTC/USD is trying to settle below $55,000, but what direction will BTC head next? The fact remains that there might not be consensus since the Bitcoin prices bounced off a historic upward trend, it may likely enter back into a bull phase but if the coin tries to retest the $54,000 low, it may collapse further to form a longer-term bear sequence.
What to Expect from Bitcoin (BTC)
BTC/USD is currently trading at $55,300 with an intraday loss of 2.21%. Although one can simply say that the prevailing trend is still bullish with expanding volatility but a break below the lower boundary of the channel may likely form a new trend. In this case, Bitcoin could fall below $53,500 support and further movement may likely hit the critical supports at $51,000, $49,000, and $47,000.
However, should the bulls hold the price and push it above the moving averages; BTC/USD could hit $59,000 vital resistance. A further high drive could send the coin to $60,000, $62,000, and $64,000 resistance levels. More so, the RSI (14) is still facing the downside, which indicates that additional bearish momentum may continue to play out.
BTC/USD Medium – Term Trend: Bearish (4H Chart)
Looking at the 4-hour chart, the bears are now dominating the market tremendously, but the bulls may need to defend the $55,000 support. Meanwhile, the $53,000 and below may come into play if the Bitcoin price breaks below the moving averages.
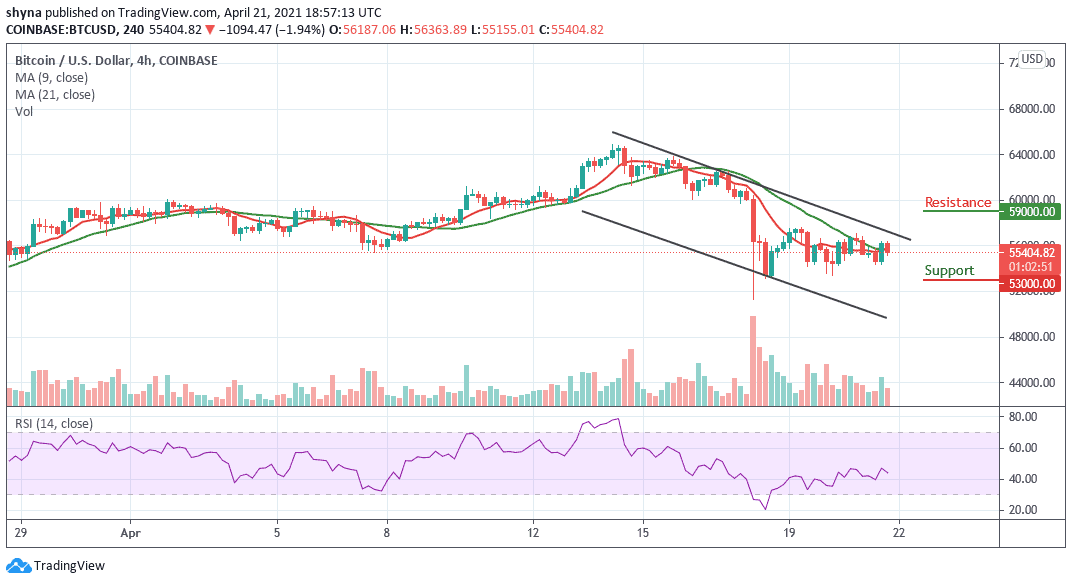
However, if the buyers can reinforce and power the market, traders may expect a serious push above the upper boundary of the channel, and breaking this barrier may further hit the potential resistance at $59,000 and above. On the other hand, the RSI (14) is moving below 45-level, indicating a continuation of the bearish movement.
Join Our Telegram channel to stay up to date on breaking news coverage
