Join Our Telegram channel to stay up to date on breaking news coverage
Bitcoin (BTC) Price Prediction – March 24
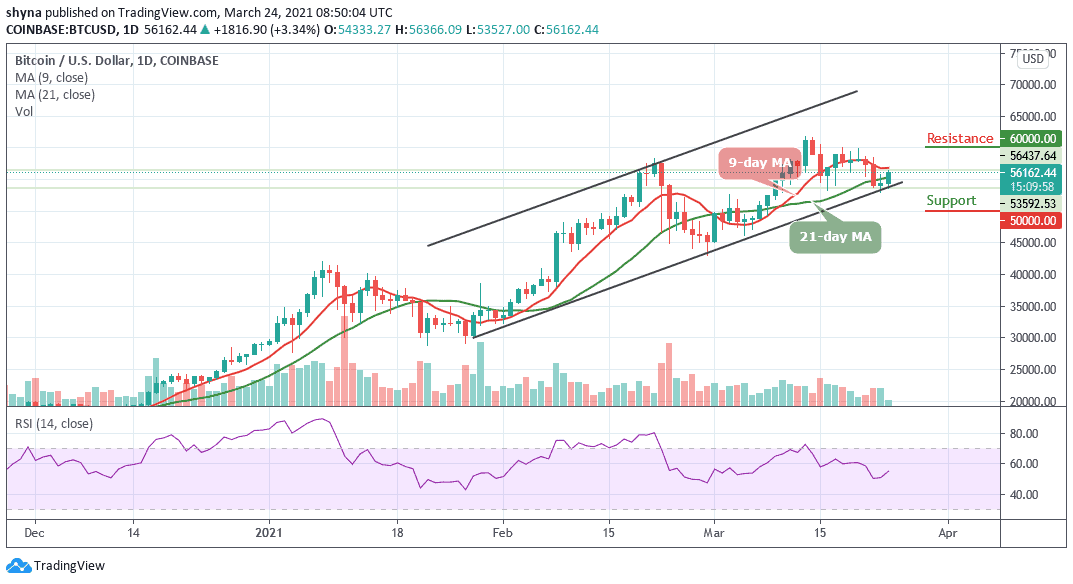
The Bitcoin price is bullish as the market surges higher after retesting the previous support at the $54,000 level.
BTC/USD Long-term Trend: Bullish (Daily Chart)
Key levels:
Resistance Levels: $61,000, $62,000, $64,000
Support Levels: $50,000, $48,000, $46,000
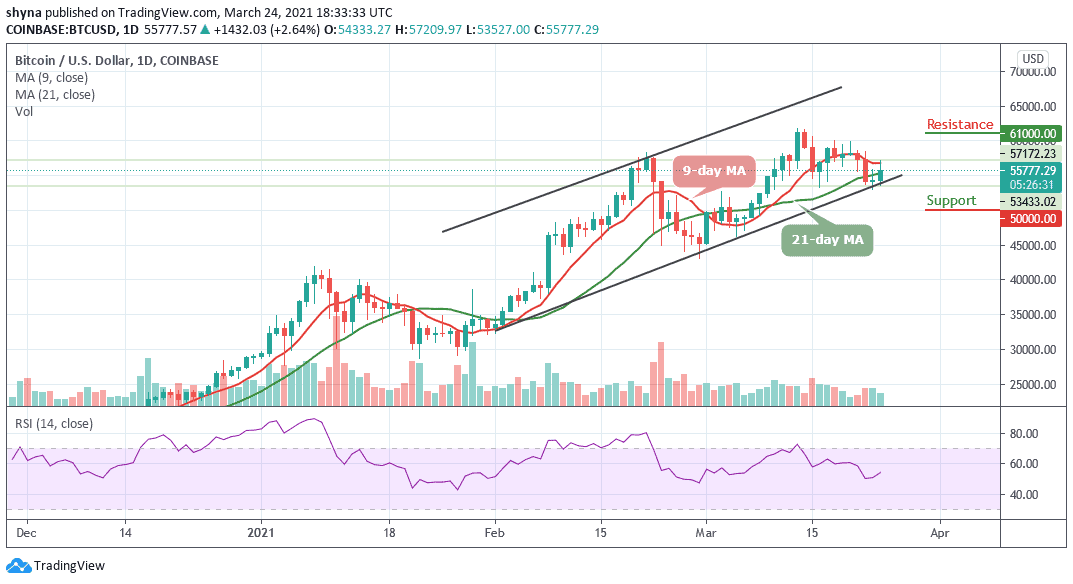
BTC/USD begins today’s trading at $54,333 after very calm movement and the market has been moving much higher as it looks to retest resistance at the $57,000 level. Therefore, if the bulls continue to move the coin towards the north, traders are likely to see the resistance broken. Alternatively, the market may reverse and set another lower swing high, which should lead to more downside over the next few days.
What to Expect from Bitcoin
Bitcoin price prediction shows that a recovery rally is in the works, since the market price is not declining below the 21-day moving averages, the sideways trading may come to play and probably favor the bulls. But, once BTC/USD crosses above $58,000 resistance, the price may likely jump to the next higher end of the resistance line at $59,000. Of course, the daily charts still paint a higher target of $60,000 despite the current stagnant price action.
However, the technical indicators, RSI (14) is flashing bullish signal as the signal line moves above 50-level. Meanwhile, the initial support lies below the lower boundary of the channel, and buyers may be looking to build long positions near $52,000 low to target another high. On the other hand, any bearish movement below the channel may hit the supports at $50,000, $48,000, and $46,000.
BTC/USD Medium – Term Trend: Ranging (4H Chart)
Looking at the 4-Hour chart, the bears now dominate the market by trading around the 9-day and 21-day moving averages at $55,438. Although, the Bitcoin price has not yet slipped below the moving averages and it’s still in the loop of making a bounce back. However, the price of Bitcoin may take a little time to persistently trade above $57,000.
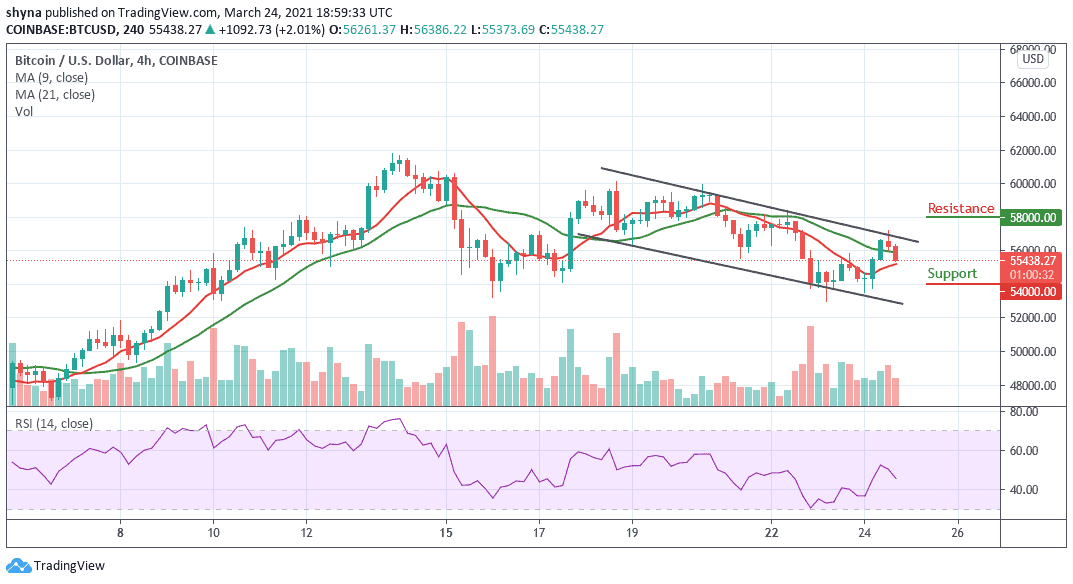
Moreover, BTC/USD may continue to trade beneath if the 21-day MA is above the 9-day MA. More so, any upward movement could push the price near the resistance levels of $58,000 and above while the immediate support levels lie at $54,000 and above. Meanwhile, the RSI (14) follows the downtrend which suggests that more bearish signals may come into play.
Join Our Telegram channel to stay up to date on breaking news coverage