Join Our Telegram channel to stay up to date on breaking news coverage
Bitcoin (BTC) Price Prediction – March 24
The Bitcoin price is seen trading above $56,000 and the coin must climb above the $58,000 resistance to continue higher.
BTC/USD Long-term Trend: Bullish (Daily Chart)
Key levels:
Resistance Levels: $60,000, $62,000, $64,000
Support Levels: $50,000, $48,000, $46,000
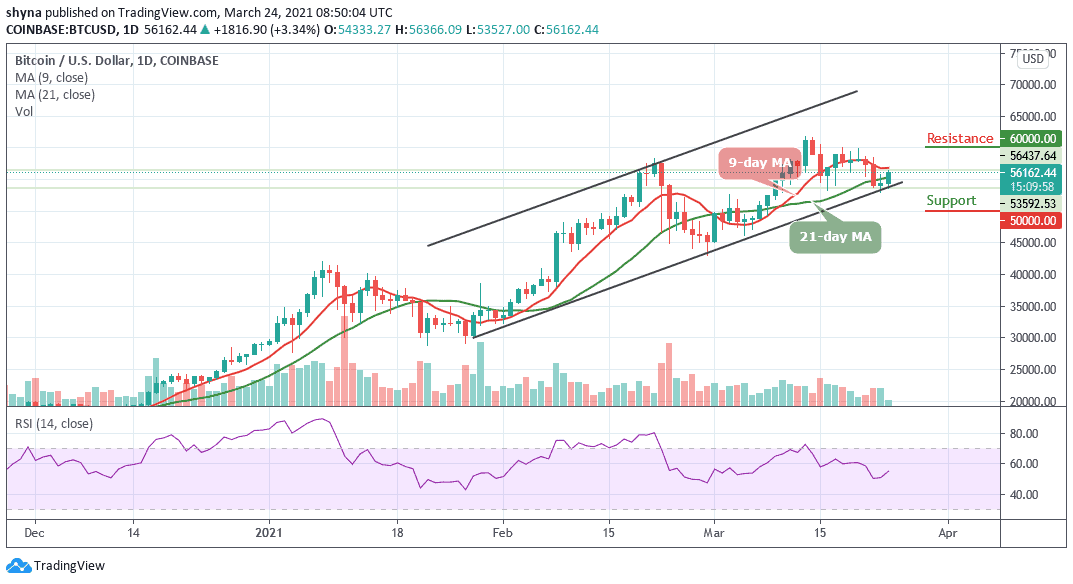
BTC/USD bulls may slowly come back into action after a minor battering from the bears a couple of days ago. Once this is done, the expectation of recovery could turn out to be true. At the time of writing, BTC/USD remains above $56,000 after soaring to $56,366. The coin then pulled back to where it is trading currently at $56,162 and may continue to head upwards if the bulls maintaining the trend.
Where is BTC Price Going Next?
The market is deciding above the 21-day moving average, where the buyers and sellers are anticipating a clear breakout or breakdown. Meanwhile, the $58,000 and $59,000 levels may further surface as the key resistances should the $57,000 level come to play. However, a strong bullish spike may take the price to $60,000, $62,000, and $64,000 resistance levels.
Moreover, if the market makes a quick turn to the south, BTC/USD price may likely drop to $53,500, and should this support fails to contain the sell-off, traders may see a further roll back to $50,000, $48,000, and critically $46,000. The technical indicator RSI (14) suggests an upward movement for the coin as it stays above 54-level.
BTC/USD Medium-Term Trend: Bullish (4H Chart)
The 4-hour chart for BTC is range-bound and the intraday trading is now looking bullish; following the recent downtrend to $53,527 which is now a key support level. However, the next key support levels are located at $54,000, $52,000, and $50,000.
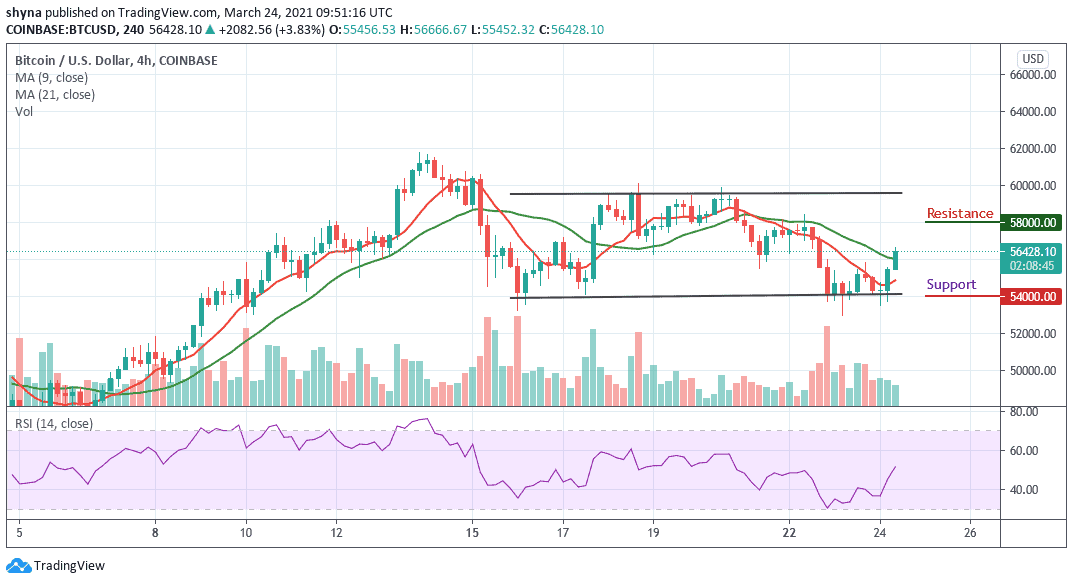
However, considering the recent early rebound, the Bitcoin price may re-enter the bullish rally to $57,000 resistance. A climb above the mentioned resistance may further push the price to $58,000, $60,000, and $62,000 resistance levels. As it is now, it seems the bulls have come to stay as the technical indicator RSI (14) moves above 50-level which could trigger the upward direction.
Join Our Telegram channel to stay up to date on breaking news coverage