Join Our Telegram channel to stay up to date on breaking news coverage
Bitcoin (BTC) Price Prediction – March 22
According to the daily chart, the Bitcoin price is yet to gain strength above the $60,000 resistance as the coin keeps showing a few bearish signs.
BTC/USD Long-term Trend: Bullish (Daily Chart)
Key levels:
Resistance Levels: $63,000, $65,000, $67,000
Support Levels: $53,000, $51,000, $49,000
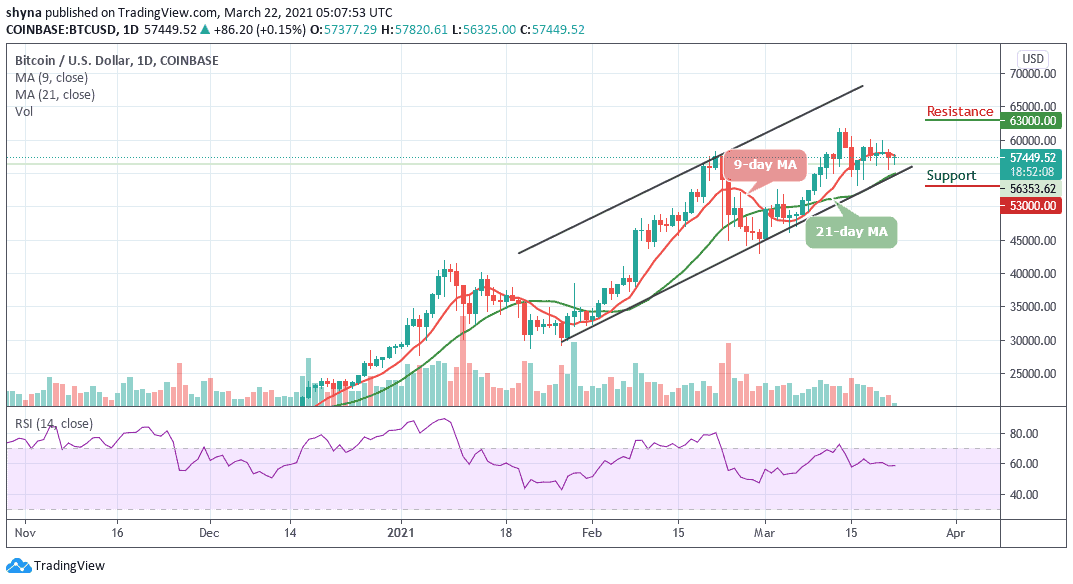
After another failure to clear the $60,000 resistance, BTC/USD remain below the 9-day and 21-day moving averages. The Bitcoin price may start another fresh decline if bulls failed to push it above the moving averages. At the opening of today’s trading, the BTC price breaks the $57,000 support level to move into a bearish zone.
What is the Next Direction for Bitcoin?
As the Bitcoin (BTC) trades below the moving averages, if it crosses below the 21-day MA, it may start showing bearish signs below the $57,000 and $56,000 levels. More so, if there are more losses, the price could break the $55,000 low as the next major support for the bulls sits near the $53,000, $51,000, and $49,000 levels. Meanwhile, the technical indicator RSI (14) is seen moving below 60-level, any further cross below this level may increase the bearish movement.
On the other hand, if the first digital asset stays above the moving averages, it could start another fresh increase and an initial resistance on the upside is near the $58,200 level. Moreover, the main resistance is near the $60,000 level and a clear break above the $60,000 level may possibly push the price towards the key $62,000 resistance zone. Any more gains could start a pump towards the $63,000, $65,000, and $67,000 resistance levels.
BTC/USD Medium – Term Trend: Ranging (4H Chart)
On the 4-hour chart, we expect the coin to gain the lost momentum and hit the trade above $60,000. However, the volatility hovers, and the selling pressure still exists which leads the coin not to be able to cross above the 9-day and 21-day moving averages. Meanwhile, the $55,000 and below may come into play if BTC breaks below the lower boundary of the channel.
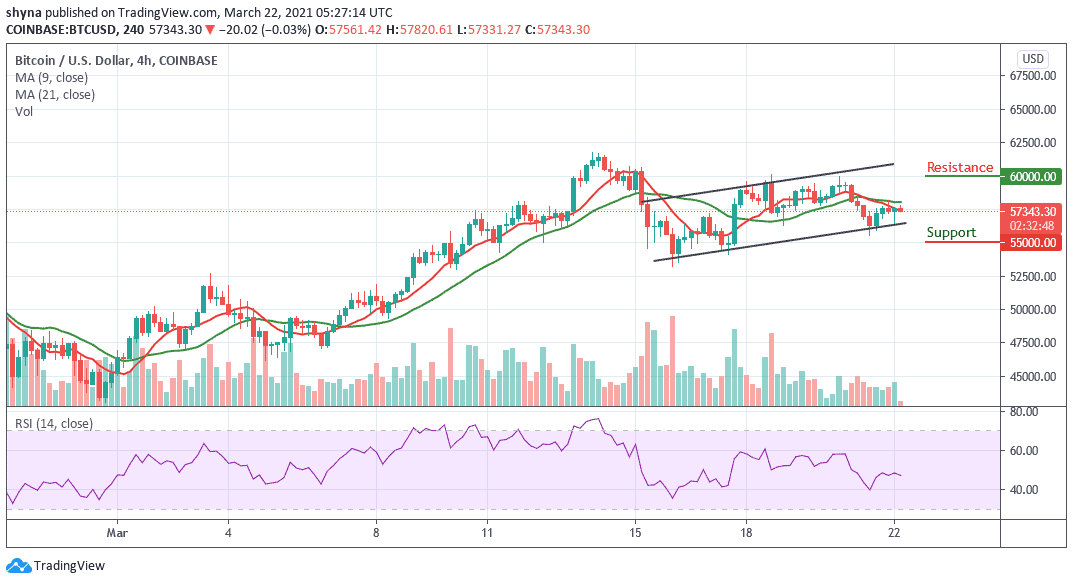
However, in as much as the buyers can still reinforce and power the market, traders can expect a retest at a $58,800 resistance level, and breaking this level may further allow the bulls to reach $60,000 and above. The RSI (14) is seen trading around 47-level which shows that more bearish signals may likely play out.
Join Our Telegram channel to stay up to date on breaking news coverage