Join Our Telegram channel to stay up to date on breaking news coverage
Bitcoin (BTC) Price Prediction – February 21
Bitcoin (BTC) is seen hovering towards $60,000 with a gain of 2.37% as the coin maintains the bullish movements.
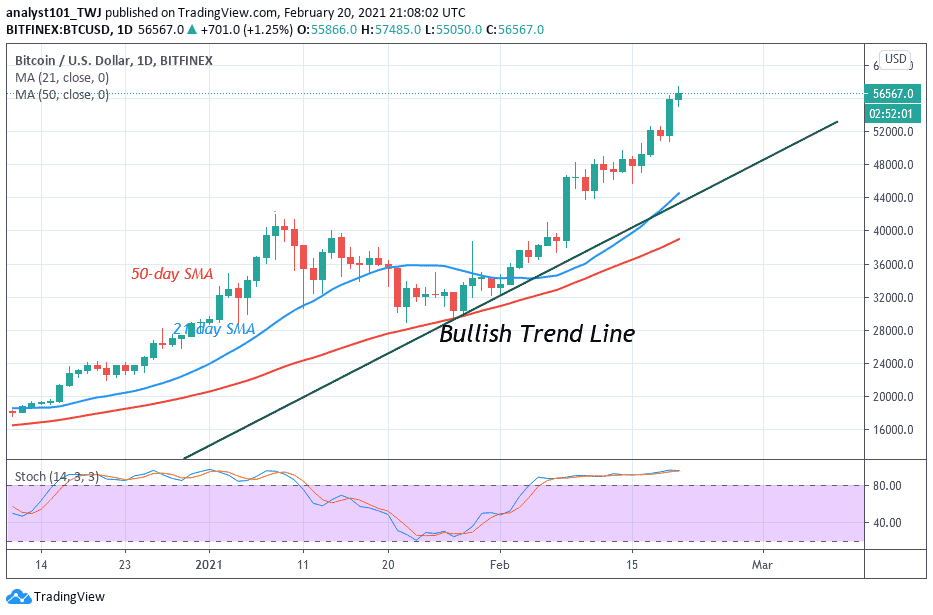
BTC/USD Long-term Trend: Bullish (Daily Chart)
Key levels:
Resistance Levels: $64,000, $66,000, $68,000
Support Levels: $50,000, $48,000, $46,000

It is very important for BTC/USD to remain above $57,000 as soon as possible, the reason being that more action is expected above this level. However, the longer Bitcoin (BTC) stays above this level, the stronger the bulls get. However, the support at $54,000 may not be enough to hold the intense pressure in case if bears step back into the market.
Where is BTC Price Going Next?
BTC/USD bulls don’t seem to give up anytime as the coin surges another 2.37% hitting its new all-time high of $57,800. The daily chart reveals that Bitcoin could gather more steam ahead and make a push above $60,000. The technical indicator RSI (14) also puts emphasis on the continuation of the uptrend as the signal line remains above 50-level. The same situation is reflected by the moving averages as the red-line of 9-MA is still above the green-line of 21-day MA.
The next 5 days could be extremely crucial for Bitcoin’s price. If the BTC price fails to break above the upper boundary of the channel in the next five days, the market price may move back below the $57,000 level or it may just sit between the $57,000 – $58,000 price range. However, the resistance levels to keep eye on are $64,000, $66,000, and $68,000 while the supports are located at $50,000, $48,000, and $46,000 respectively
BTC/USD Medium – Term Trend: Bullish (4H Chart)
Looking at the 4-hour chart, BTC/USD is seen above the 9-day and 21-day moving averages as the coin may continue to appreciate if the $58,000 resistance is broken. On the contrary, if the market price crosses below the 9-day moving average, BTC/USD may fall and reach the critical supports at $54,000, $52,000, and $50,000 respectively.
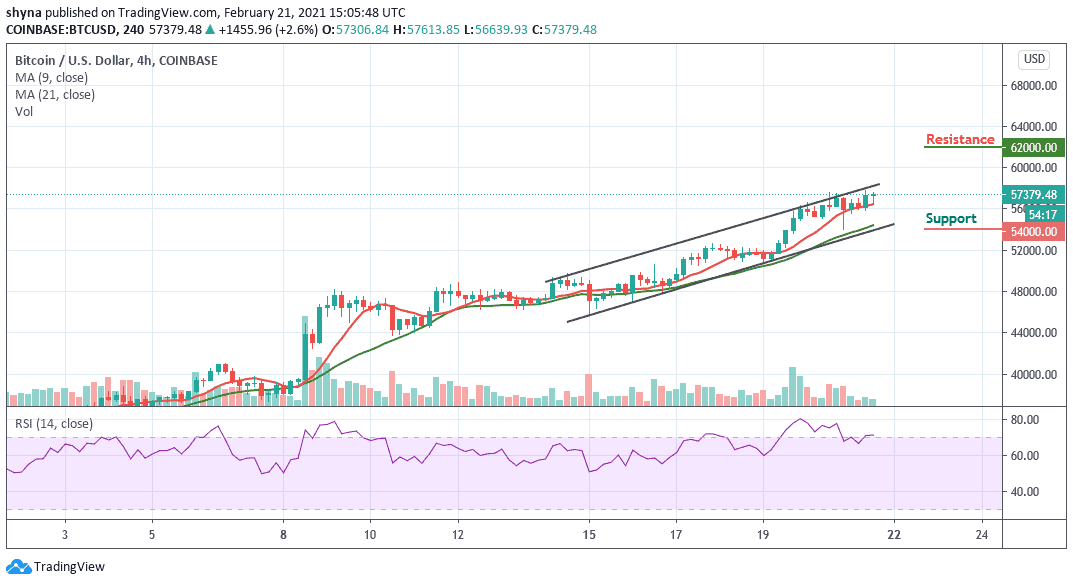
Meanwhile, if the bulls can hold the current price tight, BTC/USD may likely cross above the upper boundary of the channel to hit the potential resistance at $62,000, $64,000, and $66,000 levels.
Join Our Telegram channel to stay up to date on breaking news coverage