Join Our Telegram channel to stay up to date on breaking news coverage
Bitcoin (BTC) Price Prediction – February 20, 2021
BTC/USD is trading at $56,980 at the time of writing. Analysts have predicted that once the $50,000 psychological price level is breached, BTC price will rally to $60,000. The $50,000 resistance was broken on February 17. Three days later, the price has rallied above $56,000.
Resistance Levels: $58,000, $59,000, $60,000
Support Levels: $40,000, $39,000, $38,000
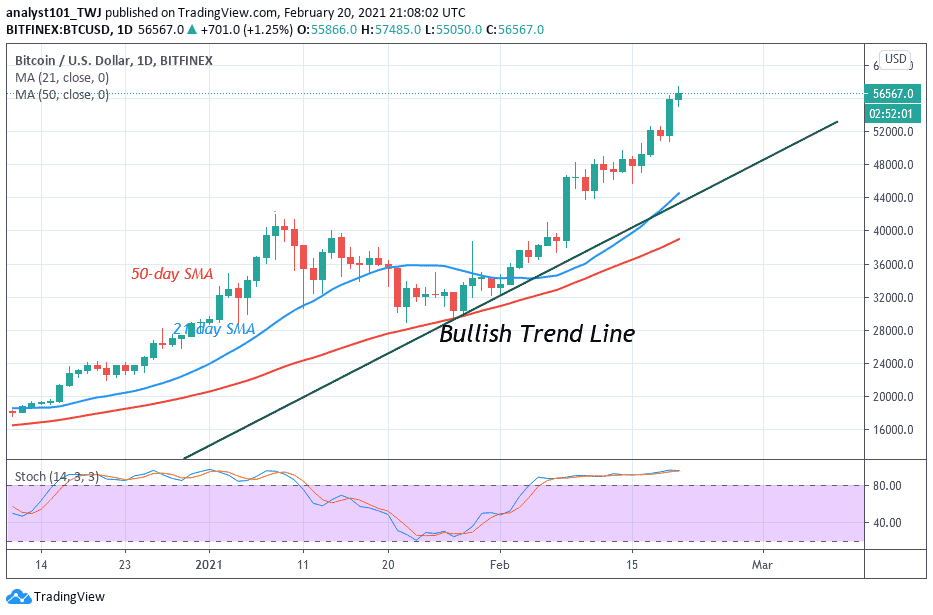
Following the breaking of the $50,000 resistance, Bitcoin has risen above $56,000 high. The upside momentum appears to be faster on the upside when compared to the previous price movement. The major resistance is the $52,500 high. BTC price corrected for two days before breaking above it. The price made a pullback to $51,000 support before resuming upward. The bullish momentum broke the $52,500 as price rallied above $56,000 high. The BTC price is currently facing resistance at $57,500. The RSI and the daily stochastic have indicated that BTC price has reached the overbought region of the market. It is doubtful if the upside momentum will continue or subside.
Bitcoin (BTC) Indicator Reading
Bitcoin is above the 80% range of the daily stochastic. It indicates that Bitcoin has been in the overbought condition since February 4. The stochastic bands are sloping horizontally above the 80% range.The moving averages are sloping northward indicating the uptrend. The crypto’s prices are well above the SMAs which indicates that Bitcoin is rising. Bitcoin is at level 88 of the Relative Strength Index period 14. It indicates that Bitcoin is in an uptrend zone and may not continue upside momentum.
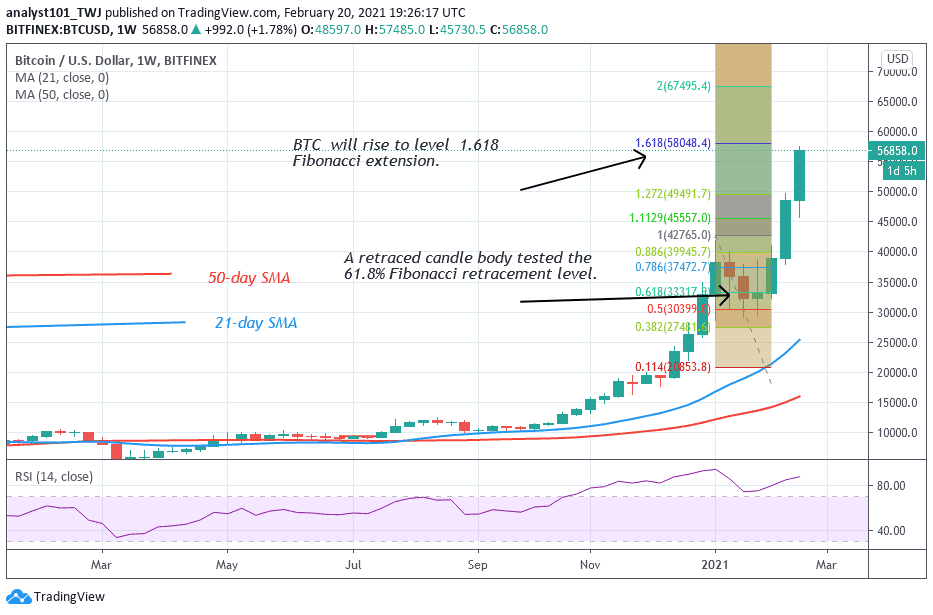
On a weekly chart, a retraced candle body on January 18, tested the 61.8% Fibonacci retracement level. The retracement implies that BTC price will rise to level 1.618 Fibonacci extension or the high of $58,048.40. The market is currently facing some resistance at a $57,000 high. If this level is crossed, the BTC price will hit $60,000.
Join Our Telegram channel to stay up to date on breaking news coverage