Join Our Telegram channel to stay up to date on breaking news coverage
XRP Price Prediction – February 20
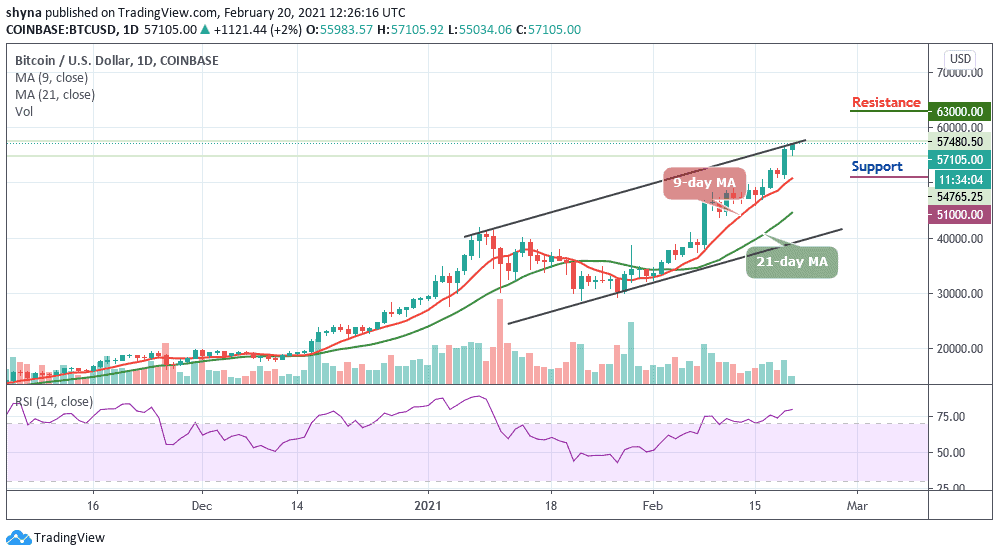
As reveals by the daily chart, XRP/USD is seen recovering from the intraday low of $0.50 amid the improved market sentiments.
XRP/USD Market
Key Levels:
Resistance levels: $0.70, $0.75, $0.80
Support levels: $0.40, $0.35, $0.30

XRP/USD regains ground after a severe sell-off to $0.50 during the early Asian hours of today. Currently, XRP/USD is changing hands at $0.54 as it is down by 4.6% since the start of the day. Despite the recovery, the coin is still lower from this time of yesterday. Ripple now takes seventh place in the global cryptocurrency market rating, with the current market capitalization of $25.7 billion.
What to Expect from Ripple (XRP)?
XRP/USD hit hard by the recent market-wide sell-off, with the cryptocurrency’s price erasing the vast majority of the gains that it has been able to gain over the past few months. Meanwhile, a sustainable move above $$0.60 is needed to improve the technical picture and set the bullish ball rolling for the coin as this resistance level has been tested but each time, the bulls always backed off.
The daily chart shows that the price recovery is capped by the 9-day moving average. This technical line has been tested as support on several occasions. Once it is out of the way, the upside is likely to gain traction with the next focus towards the resistance levels of $0.55 and $0.60. The support levels could be found at $0.40, $0.35, and $0.30 respectively.
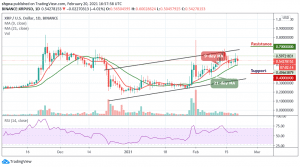
When compares with Bitcoin, the Ripple keeps moving around 947 SAT below the 9-day and 21-day moving averages. After the coin touches the daily high at 1043 SAT today, the coin later retreated back below the moving averages. Meanwhile, the bears remained the controller of the market as the sellers continued to put pressure on the market.
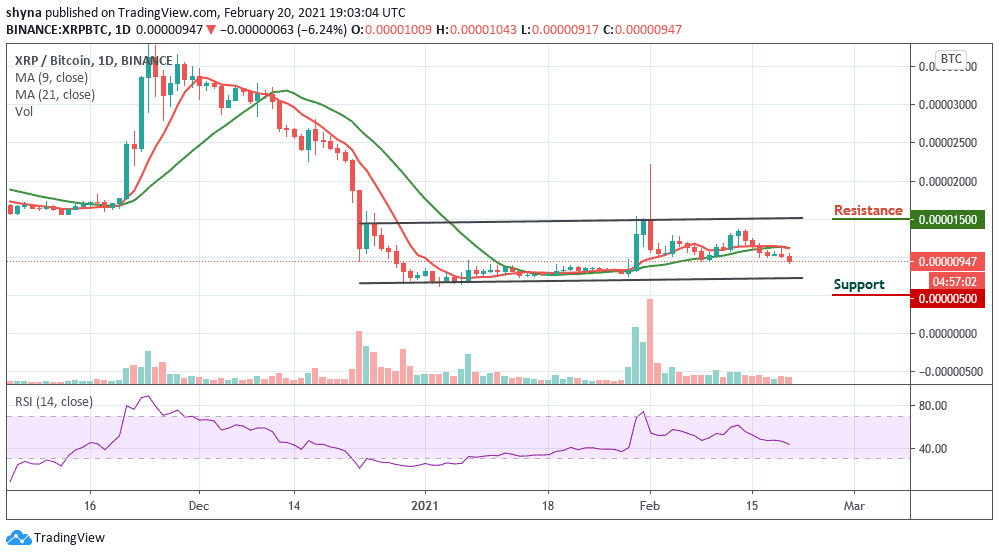
However, if the sellers put more pressure, the Ripple price may drop to 500 SAT and below. At present, the RSI (14) moves below the 45-level as the market remains at the downside of the channel while the resistance levels are located at $1500 and above.
Join Our Telegram channel to stay up to date on breaking news coverage