Join Our Telegram channel to stay up to date on breaking news coverage
Bitcoin (BTC) Price Prediction – September 12
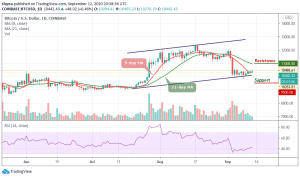
Presently, the Bitcoin bulls are working hard to nurture momentum above $10,400.
BTC/USD Long-term Trend: Bullish (Daily Chart)
Key levels:
Resistance Levels: $11,000, $11,200, $11,400
Support Levels: $9,500, $9,300, $9,100

BTC/USD has been moving towards the resistance level of $10,500. Looking at the downside, $10,000 is mostly the strong support for the coin but there are occasions where Bitcoin has dipped to lower levels as far as $9,800. At the time of writing, BTC is doddering at $10,442 after a subtle 0.46% growth in its value today. Moreover, BTC/USD is focused on climbing above $10,400 resistance and grinding to $10,800 after breaking above the moving averages.
Where is BTC Price Going Next?
BTC/USD could soon be on the way to $10,500 as the technical indicator RSI (14) moves above 40-level. Meanwhile, despite the effort put in place by the bulls, the first digital asset has not been able to attract the right volume to sustain gains. At the moment, the Bitcoin price has broken above the 9-day MA. With such a move, if accorded proper volume, it may result in majestic price movements.
However, all is not lost for the coin because if the buyers can manage to hit levels above the short term hurdle at $10,500, then the journey to $11,000, $11,200, and $11,400 resistance levels would be relatively easy. In other words, if BTC/USD springs below the $10,200 support, then another fall to $10,000 may also be a walk in the park. Any further bearish movements may lead to the supports of $9,500, $9,300, and $9,100 respectively.
BTC/USD Medium – Term Trend: Bearish (4H Chart)
On the 4-hour chart, BTC/USD is still trading above the 9-day and 21-day moving averages. A continuous movement above this barrier could boost the Bitcoin above the psychological resistance at $10,600. For now, the technical indicator RSI (14) reveals that BTC’s uptrend has fuel and is bound to continue. Any further bullish movement from the current value could lead to the potential resistance of $10,800 and above.

On the other hand, the daily range may confirm a bear flag pattern, which means that the BTC’s upward case may be jeopardized. Therefore, it is essential that bulls seize the opportunity and quickly push that breakout towards $11,000. Otherwise, another rejection at $10,500 could prematurely end the uptrend and pull the coin below the channel and move towards the support level of $10,100 and below.
Join Our Telegram channel to stay up to date on breaking news coverage