Join Our Telegram channel to stay up to date on breaking news coverage
ETH Price Prediction – September 12
Ethereum price flirts with $372 amid broad-based cryptocurrency consolidation.
ETH/USD Market
Key Levels:
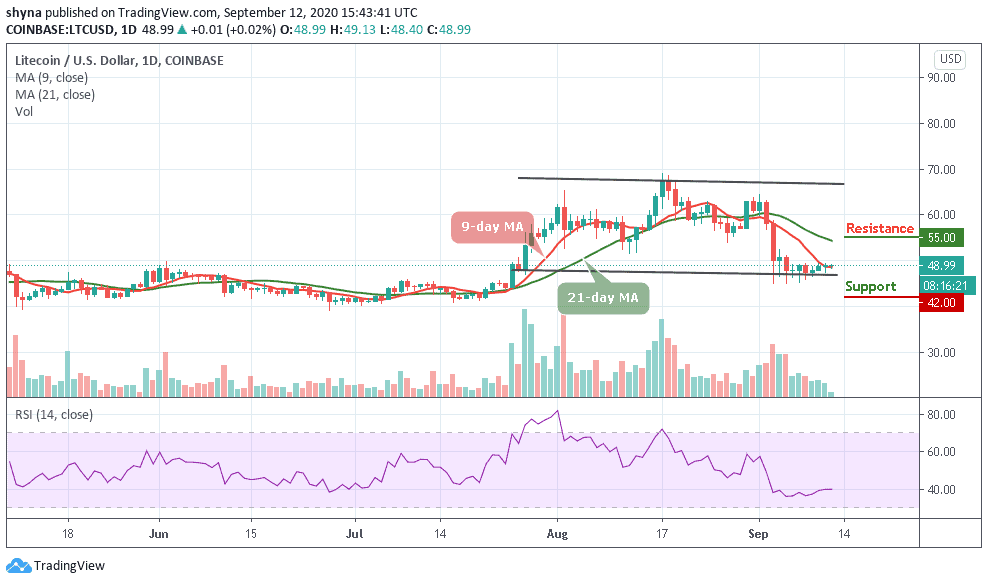
Resistance levels: $420, $440, $460
Support levels: $265, $245, $225
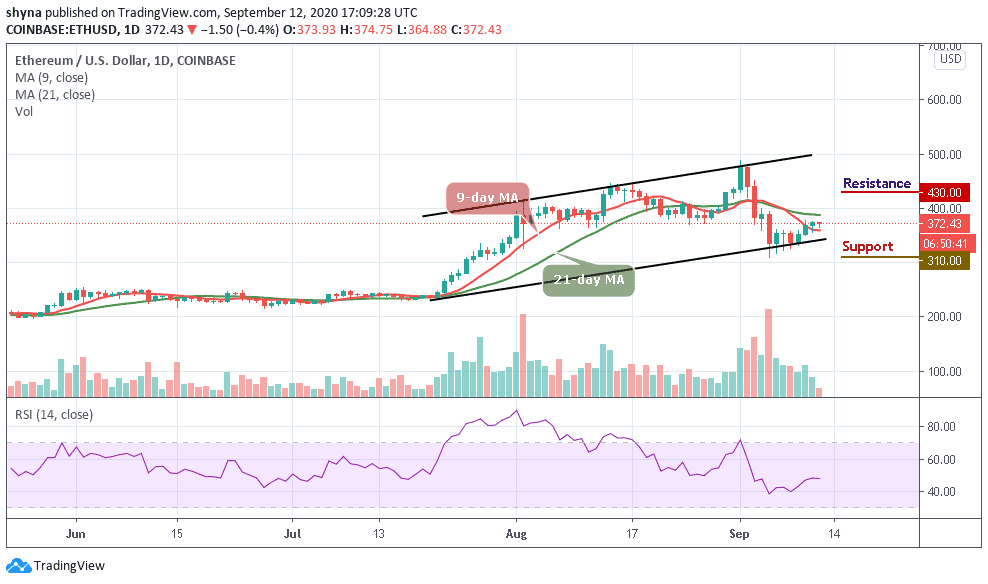
According to the daily chart, ETH/USD may be settling for consolidation, not only this but the entire cryptocurrency market is currently dealing with sideways trading action. As for the Ethereum coin, the resistance at $400 is an uphill task. At the same time, its failure to rise above this same level may likely cause the bears to explore the levels below the 9-day moving average.
What is the Next for Ethereum?
At the time of writing, ETH/USD is trading around $372 amid the much-welcomed consolidation, especially for the bulls. However, below the current market value, buyers may be forced to slide below the moving averages. For over a week, this trend-line hurdle has stood in the way of gains. Therefore, it is a must for the bulls to initiate a bullish movement above the 21-day moving average.
However, the cryptocurrency consolidation is currently emphasized by the technical picture. For instance, the RSI is leveling at 48. On the upside, the indicator is seen moving slightly above 47-level. If this motionless action continues, traders should expect Ethereum to hold in consolidation longer but if it breaks above the 21-day MA, ETH/USD may likely hit the resistance levels of $430, $450, and $470 while the supports are located at $310, $290, and $270.
Against Bitcoin, the coin has started showing some positive moves since 4 days ago. Ethereum’s bulls regained recovery after retesting the long-term support line of 3299 SAT. Although the red-line of 9-day MA is still below the green-line of 21-day MA, this might cause the price to break below the lower side of the channel to create a new low at 3300 SAT and below.
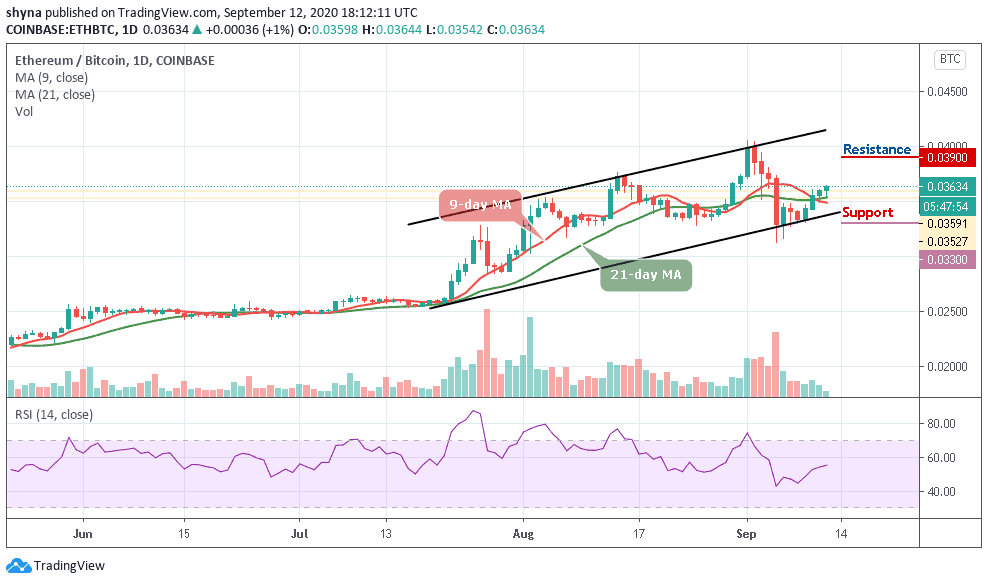
However, if the bulls can put-in more effort and remain above the moving averages, any further bullish movement could push the price towards the resistance level of 3900 SAT and above. Similarly, the technical indicator RSI (14) is moving above the 55-level, suggesting more bullish signals.
Join Our Telegram channel to stay up to date on breaking news coverage