Join Our Telegram channel to stay up to date on breaking news coverage
Bitcoin (BTC) Price Prediction – January 29
Bitcoin (BTC) bulls still remain in control as the price heads toward a $40,000 resistance level.
BTC/USD Long-term Trend: Bullish (Daily Chart)
Key levels:
Resistance Levels: $42,000, $44,000, $46,000
Support Levels: $28,000, $26,000, $24,000
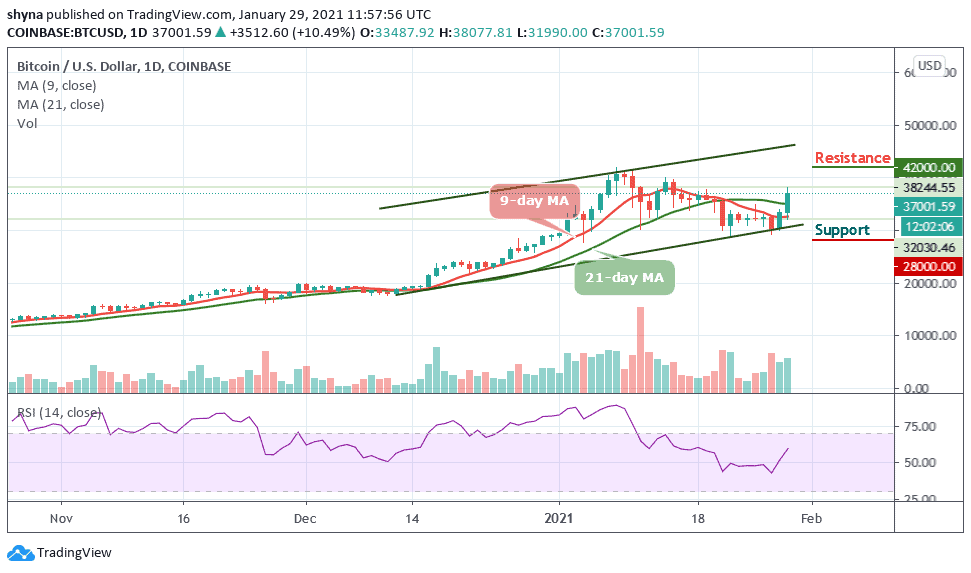
After breaking above the 9-day and 21-day moving averages, BTC/USD is seen following a bullish sentiment as the market price hits the daily high at $38,077 resistance. At the moment, the BTC price is trading around $37,000 as the bulls are gaining control of the market. It is important to realize that the market is still ready for further upside near to mid-term because the gap has not been filled.
What Levels Could BTC/USD Pullback To?
According to the daily chart, the buyers seems to be gaining control of the market, if the bulls can manage to break above the upper boundary of the channel, the next buying pressure can be expected at $42,000, $44,000, and perhaps $46,000 resistance as the market is currently crossing above the 60-level of the daily RSI (14). Meanwhile, a bounce below the 9-day moving average could send the market price below the lower boundary of the channel to reach the supports at $28,000, $26,000, and $24,000 respectively.
BTC/USD Medium-Term Trend: Bullish (4H Chart)
On the 4-hour chart, a retest of $33,500 gives the impression that the bears are not yet done. The Bitcoin price rises to fill a significant gap as the bulls remained in control which may take the coin towards the $35,500. In a short time, BTC/USD may hit $36,000 if the bullish pressure continues. Otherwise, the price may plummet to $32,000 and below.
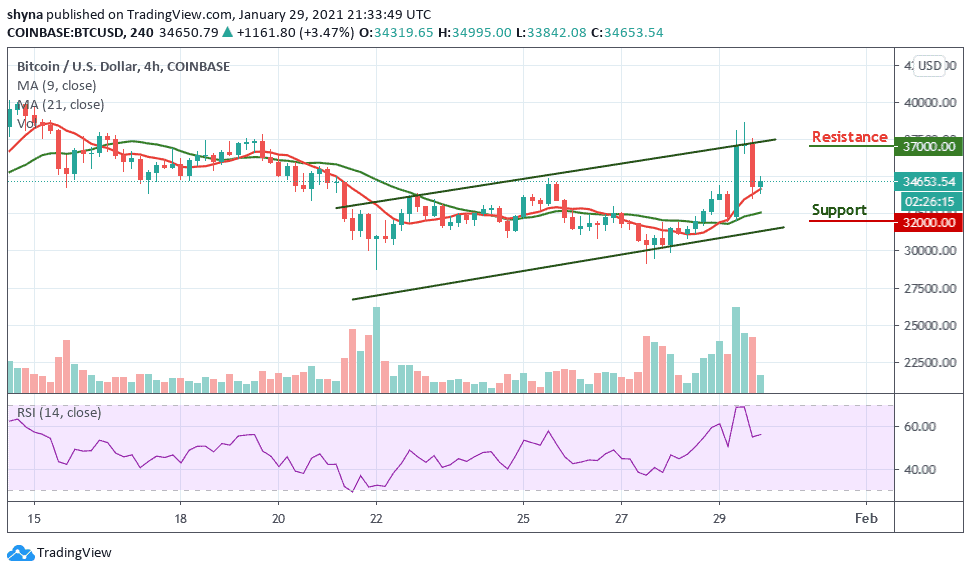
On the upside, a bullish move may continue to meet resistance at around $37,000 and above. As of now, the technical indicator RSI (14) is moving around the 55-level, now turning upward but this could simply mean that the first digital asset is looking for another close resistance. Meanwhile, a significant cross below the moving averages may send the market back into the bearish scenario.
Join Our Telegram channel to stay up to date on breaking news coverage