

Join Our Telegram channel to stay up to date on breaking news coverage
Bitcoin (BTC) Price Prediction – January 14
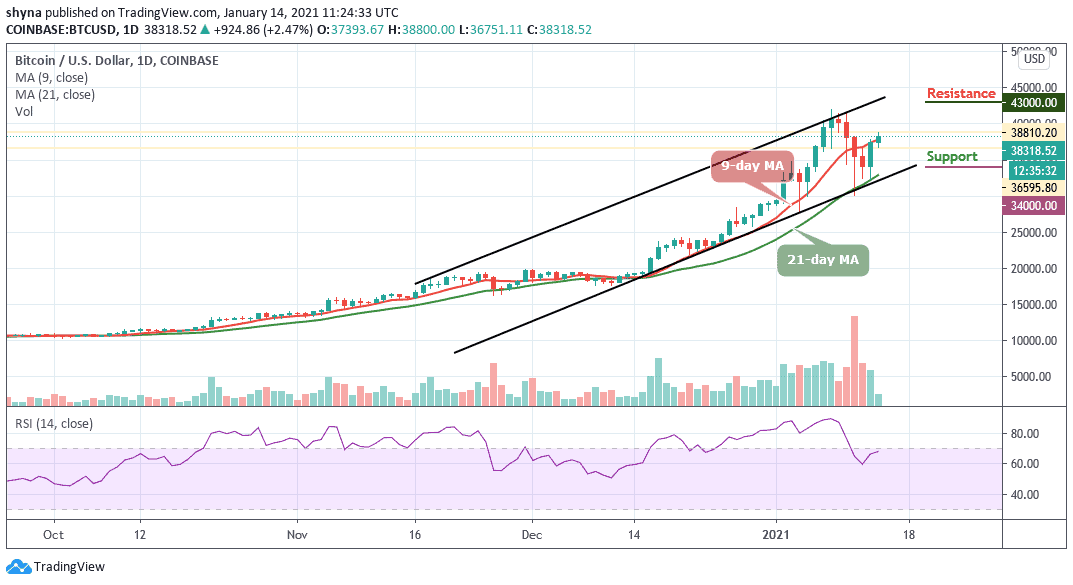
The price of Bitcoin is back above $38,000 as the recovery is coming up slowly.
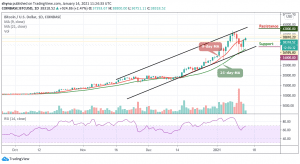
BTC/USD Long-term Trend: Bullish (Daily Chart)
Key levels:
Resistance Levels: $43,000, $45,000, $47,000
Support Levels: $34,000, $32,000, $30,000
BTC/USD has once again made an impressive move to the upside during the early trading session today but the coin is currently trading below $7,500 after touching the key resistance at $7,676.57. In order for things to change in the near-term, traders would need to see BTC/USD make a higher high and a higher low to invalidate the current downtrend that is still intact.
Will BTC Break Through Resistance Level $40,000 or Reverse?
According to the daily chart, the Bitcoin price is trading above the 9-day and 21-day moving averages. If the price ends up closing above the 9-day MA, the market would have reason to be bullish not just till $40,000 but even beyond that to $42,000 or higher. However, despite the recent bullishness in the market, traders are yet to see the on-going correction come to completion, whereas, the Bitcoin bulls are still too optimistic.
In addition, if Bitcoin bulls hold the price above the 9-day and 21-day moving averages; the price could rise towards the upper boundary of the channel and could move to the resistance level of $41,500. A further high drive could send the coin to $43,000, $45,000, and $47,000 resistance levels. Meanwhile, the RSI (14) is warming-up to revisit the overbought zone, which shows an additional bullish movement but the support levels to watch are $34,000, $32,000, and $30,000 respectively.
BTC/USD Medium – Term Trend: Bullish (4H Chart)
BTC/USD is seen performing well at present. With this, we expect the coin to gain the lost momentum and hit the trade above $38,000. However, the volatility hovers, and the selling pressure still exists which may lead the coin to lose the major support from the moving averages. Meanwhile, the $34,000 and below may come into play should BTC breaks below the moving averages.
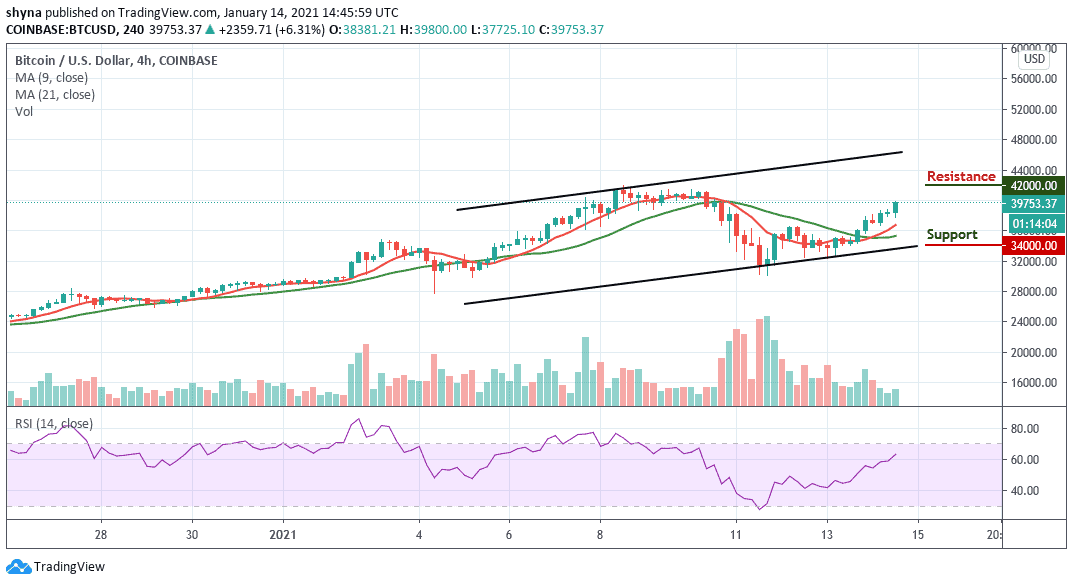
However, in as much as the buyers continue to reinforce and power the market, traders may expect a retest at a $40,000 resistance level, and breaking this level may further allow the bulls to reach $42,000 and above. The RSI (14) is moving above the 60-level which shows that more bullish signals are coming.
Join Our Telegram channel to stay up to date on breaking news coverage
