Join Our Telegram channel to stay up to date on breaking news coverage
Bitcoin (BTC) Price Prediction – January 27
Over the past few days, the Bitcoin price has remained under continuous selling pressure as the coin slipped below the $31,000 level.
BTC/USD Long-term Trend: Bearish (Daily Chart)
Key levels:
Resistance Levels: $37,000, $39,000, $41,000
Support Levels: $25,500, $23,500, $21,500
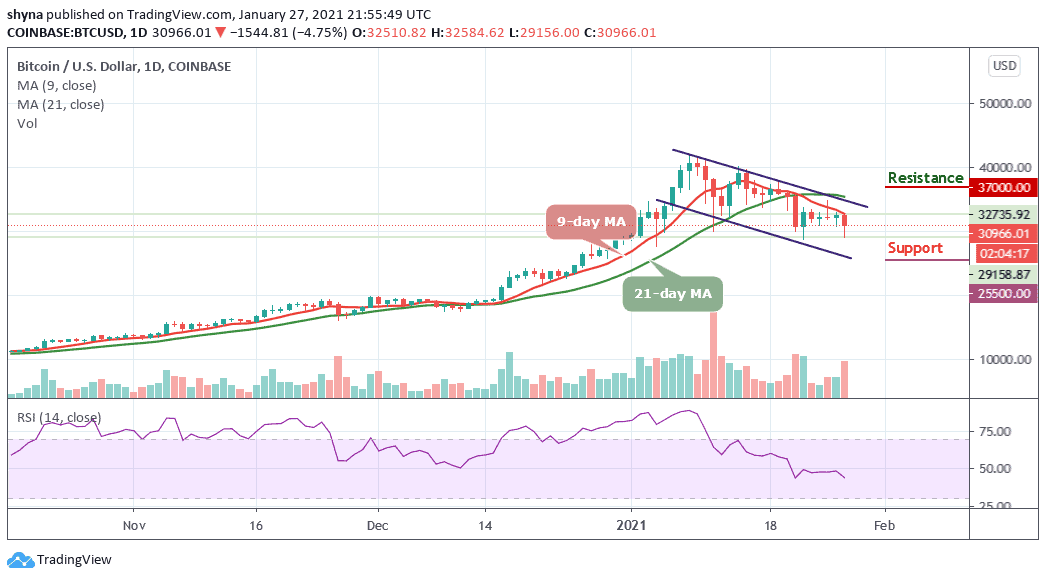
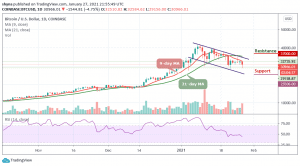
BTC/USD is stuck within a tight consolidating range with bears ensuring the price remains below $31,000. Moreover, the king coin cannot break higher resistance at $35,000, and bears are currently having a stronghold over the pair at current price levels. More so, BTC/USD breaches the lower support level at $30,000, but the price is managing to climb above this level to ensure that the first digital asset remains within the 9-day and 21-day moving averages.
What to Expect from Bitcoin (BTC)
In the past 24 hours, the Bitcoin price is gradually moving towards the south as the pair continues to drift lower. Nonetheless, the supports at $30,000 and $29,000 are holding up well so far. In addition, BTC/USD is moving within an expanding descending channel with a bearish bias. Meanwhile, the technical indicator RSI (14) is seen moving below the 50-level, therefore, the lower levels may open up once the pair closes below the $30,000 support level and the sell-off may likely reach the support levels of $25,500, $23,500, and $21,500 respectively.
On the daily chart, the bulls will need to see a sustainable move above the upper boundary of the channel to mitigate the initial bearish pressure. Should in case the coin manages to recover above this handle, then the upside momentum may gain traction and could take BTC/USD to $37,000, $39,000, and $41,000 resistance levels.
BTC/USD Medium-Term Trend: Bearish (4H Chart)
According to the 4-hour chart, after BTC/USD faced a long period of consolidation within its previously established trading range, the Bitcoin bears have now taken control and pushed the BTC price below its previous support level that existed around $31,000. Although, the Bitcoin price has not yet slipped below $30,000 and it’s still in the loop of making a bounce back.
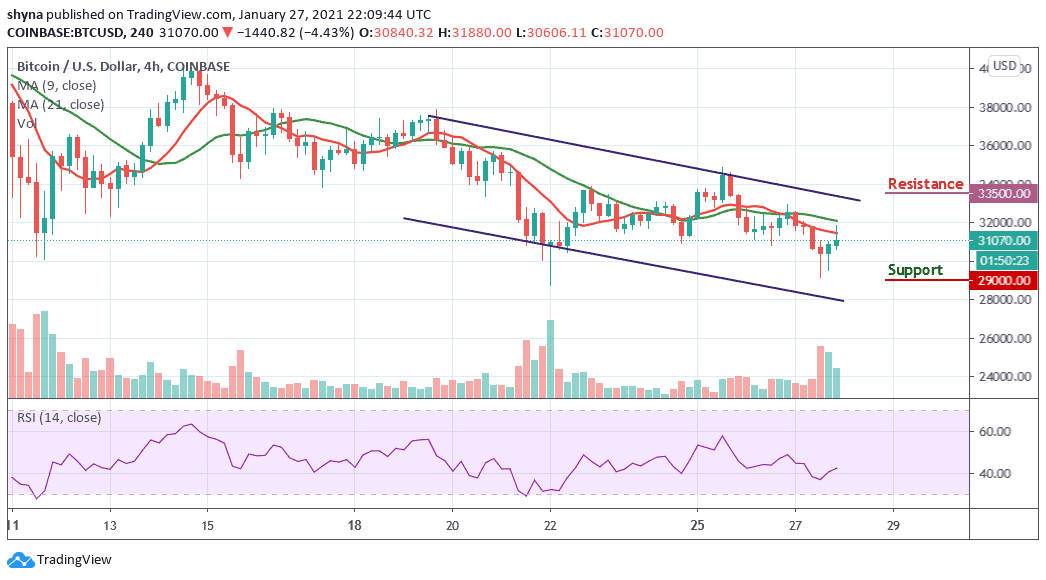
At the moment, BTC/USD is currently moving below the 9-day and 21-day moving averages while the upward movement may likely push the price near the $33,500 and above but the immediate support lies at $29,000 and below. The RSI (14) is crossing above the 40-level, more bullish signals may play out.
Join Our Telegram channel to stay up to date on breaking news coverage